
Trade The World
Sei, Starknet extend declines amid token unlock volatility
Par John Isige
Date de publication: 16 Sep 2025 | Date de modification: 16 Sep 2025


POPULAR ARTICLES

The cryptocurrency market faces price instability on Monday, led by Bitcoin (BTC), which is currently below $115,000. Sei (SEI) and Starknet (STRK) have not been spared the spike in volatility, which could be exacerbated by the respective token unlocks that occurred earlier in the day.
- Sei extends decline as $30 million token unlock risks diluting valuation.
- Starknet token unlock progress hits 21.3% of supply cap as 127.6 million STRK enter market.
- Token unlocks allow issuers to manage supply, incentivize stakeholders and fund development.
The cryptocurrency market faces price instability on Monday, led by Bitcoin (BTC), which is currently below $115,000. Sei (SEI) and Starknet (STRK) have not been spared the spike in volatility, which could be exacerbated by the respective token unlocks that occurred earlier in the day.
Sei, a native Layer-1 protocol token, is trading at $0.3135, down over 5%, while Starknet, powering a decentralized Layer-2 ledger on Ethereum (ETH), hovers at $0.1313 at the time of writing.
Sei token unlock triggers price volatility
The Sei network has completed a token unlock event, which resulted in the release of 95.15 million SEI, valued at approximately $30 million. The unlock accounts for 1.55% of the total market capitalization of $1.98 billion, according to CryptoRank data.
So far, the network has released 72.4% of the total supply, approximately 7.24 billion SEI, with 2.76 billion SEI still vested.
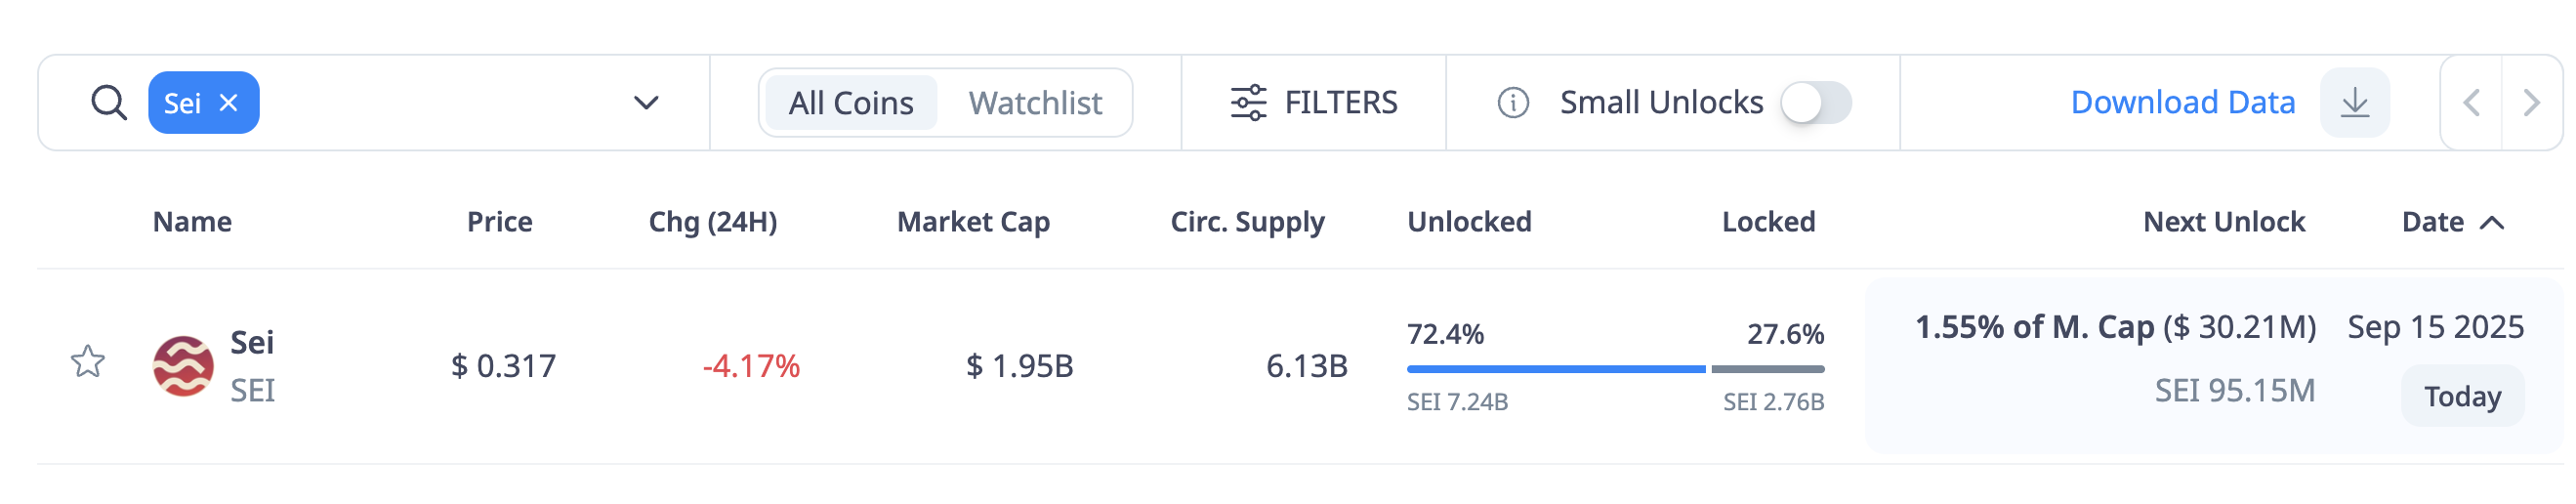
SEI token unlock | Source: CryptoQuant
Following the unlock, the SEI price extended the decline from an intraday high of $0.3382 to $0.3135. Technical indicators on the daily chart below show that Sei is at risk of extending the decline.
A sharp drop in the Relative Strength Index (RSI) from 62 to 50 indicates fading bullish momentum. Lower RSI readings below the midline, heading towards oversold territory, could indicate the path of least resistance is downward.
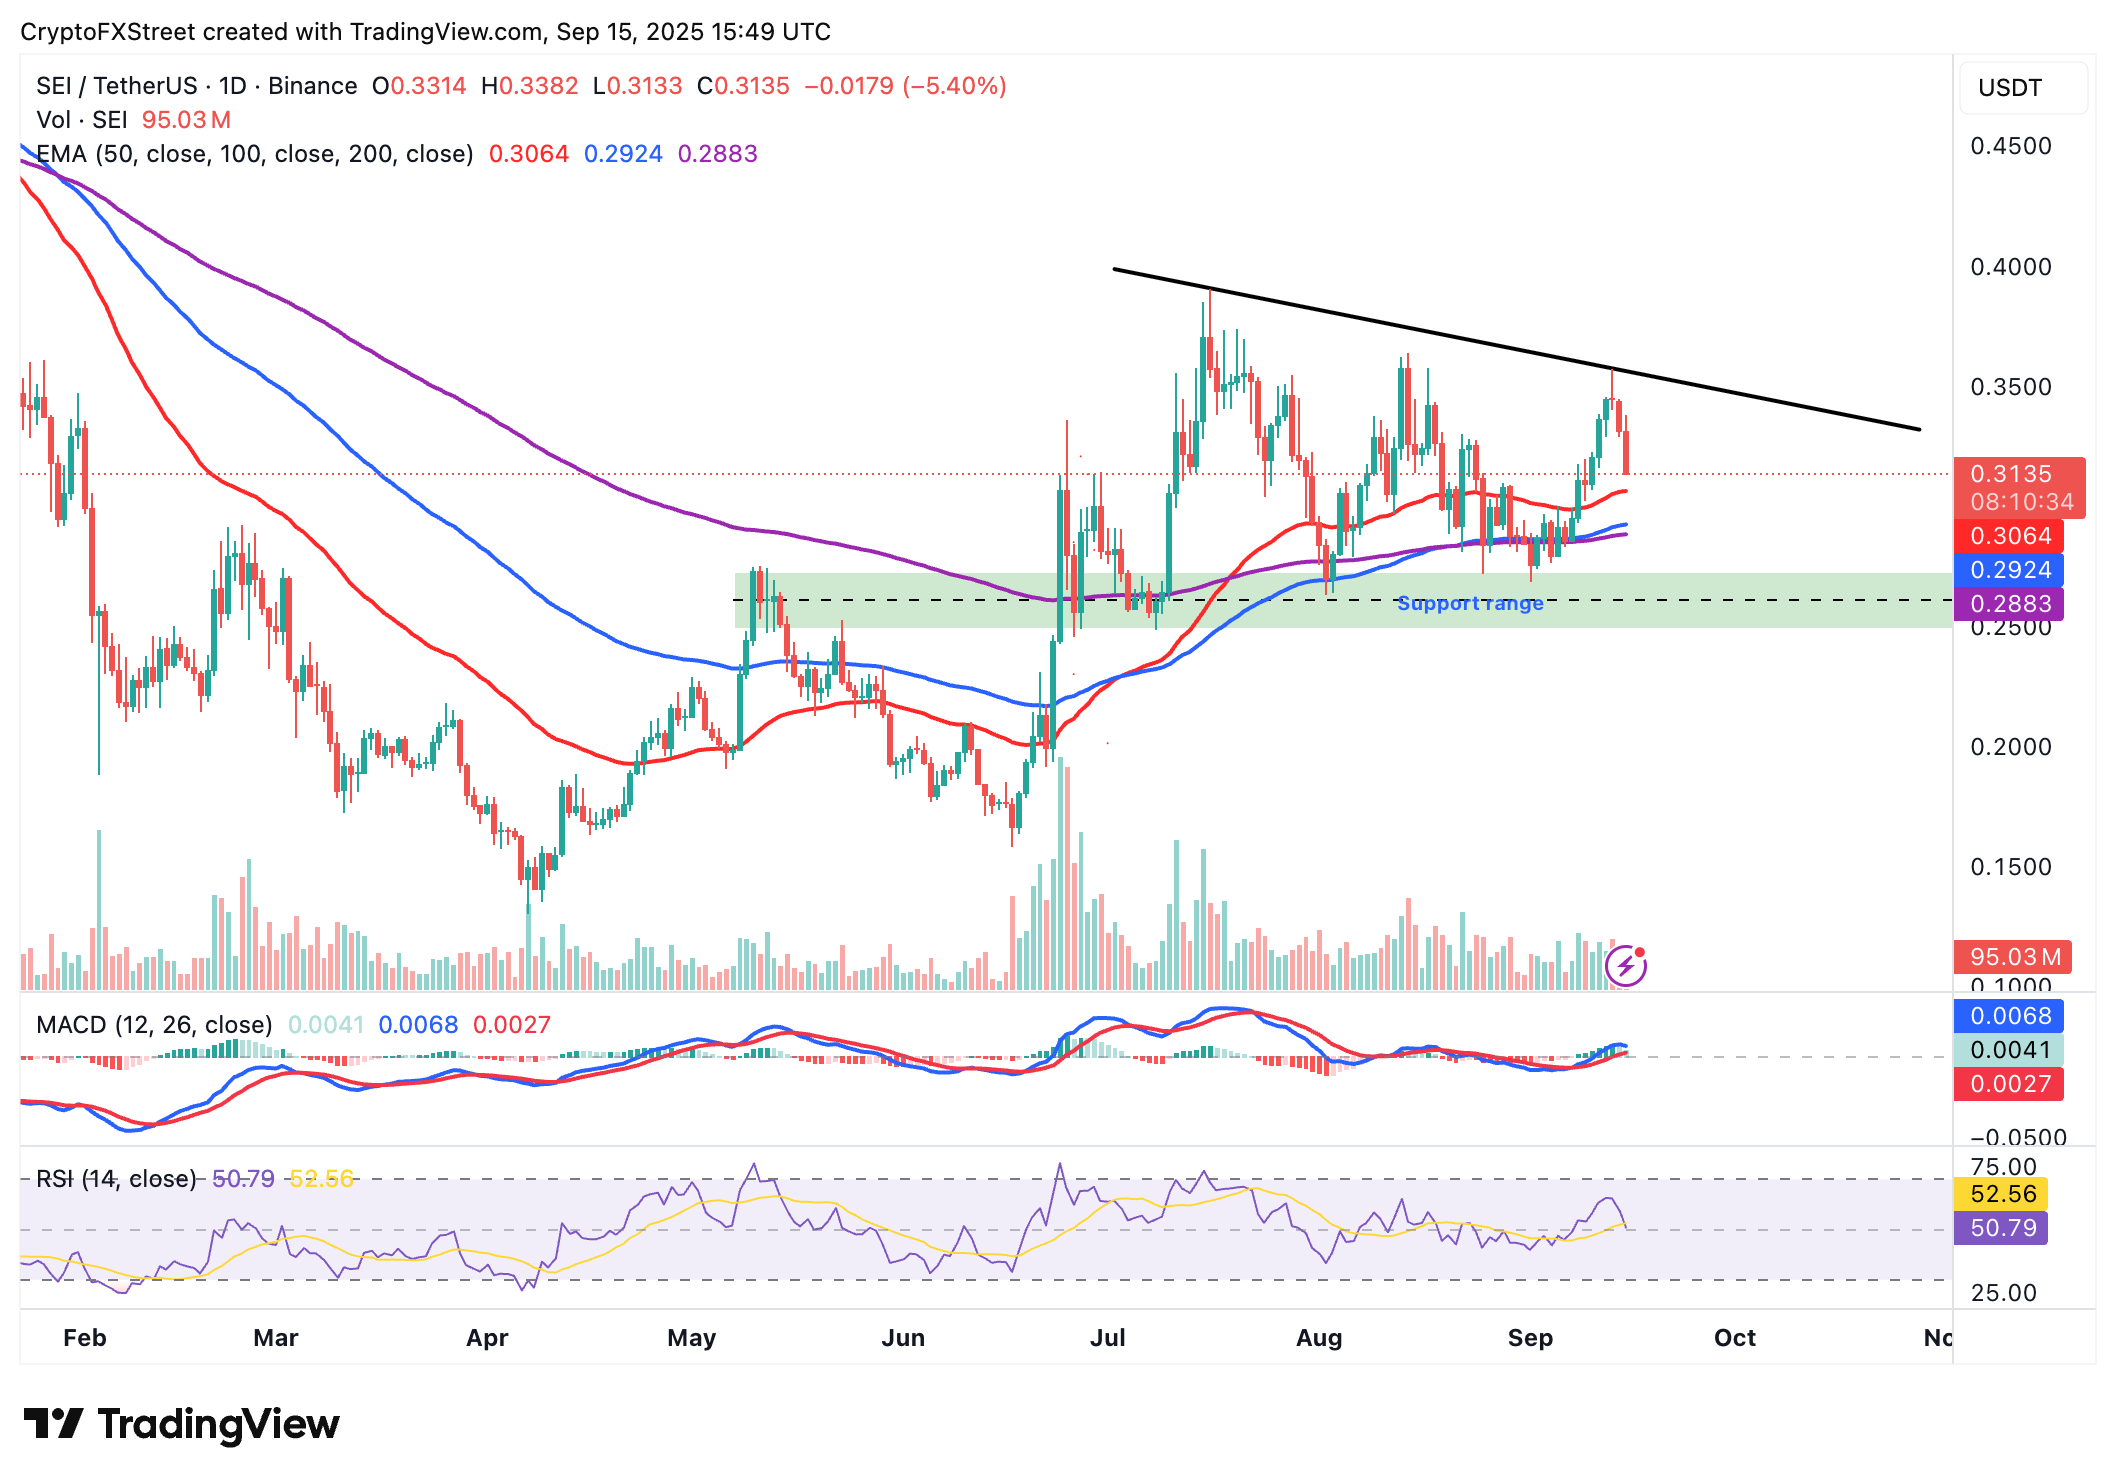
SEI/USDT daily chart
Key levels traders should consider monitoring in the short term are the 50-day Exponential Moving Average (EMA) at $0.3064, the 200-day EMA at $0.9524 and the 200-day EMA at $0.2883, all of which could serve as tentative support levels if declines persist.
Starknet eyes 43% triangle breakout after token unlock
The Starknet protocol has released an additional 127.6 million STRK tokens, valued at $16.8 million, which have joined the circulating supply. According to CryptoRank data, this unlock event accounted for 3.13% of Starknet’s $537 million market capitalisation. With only 22.62% of the total supply unlocked, investors should brace for future supply shocks.
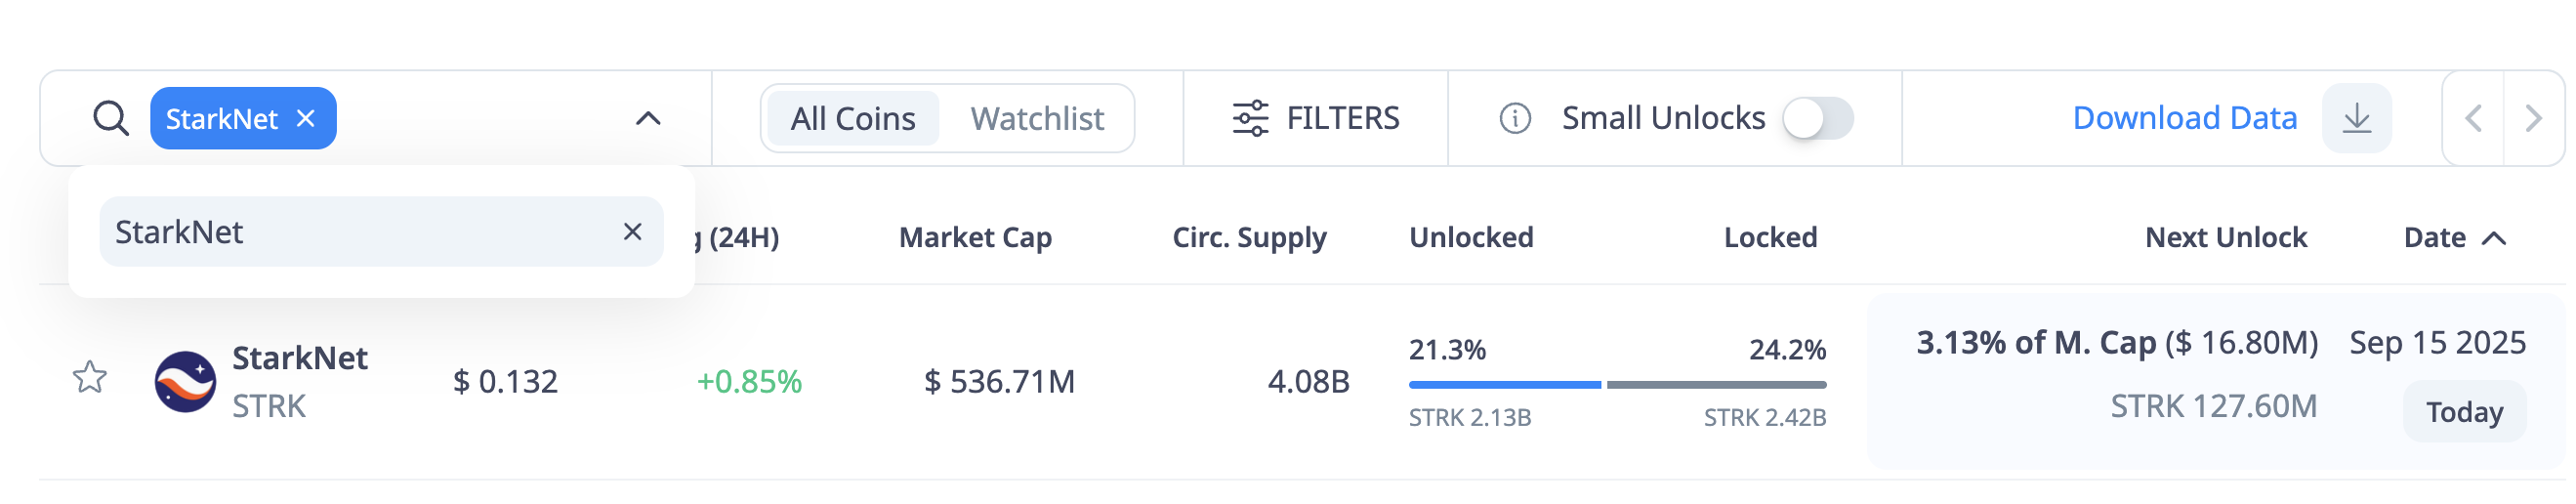
Starknet token unlock | Source: CryptoQuant
After the token unlock, Starknet experienced an increase in volatility, with the price fluctuating between an intraday high of $0.1453 and a low of $0.1295. The token currently holds above the 50-day EMA at $0.1303 while the 100-day EMA at $0.1360 caps upside action in the daily time frame.
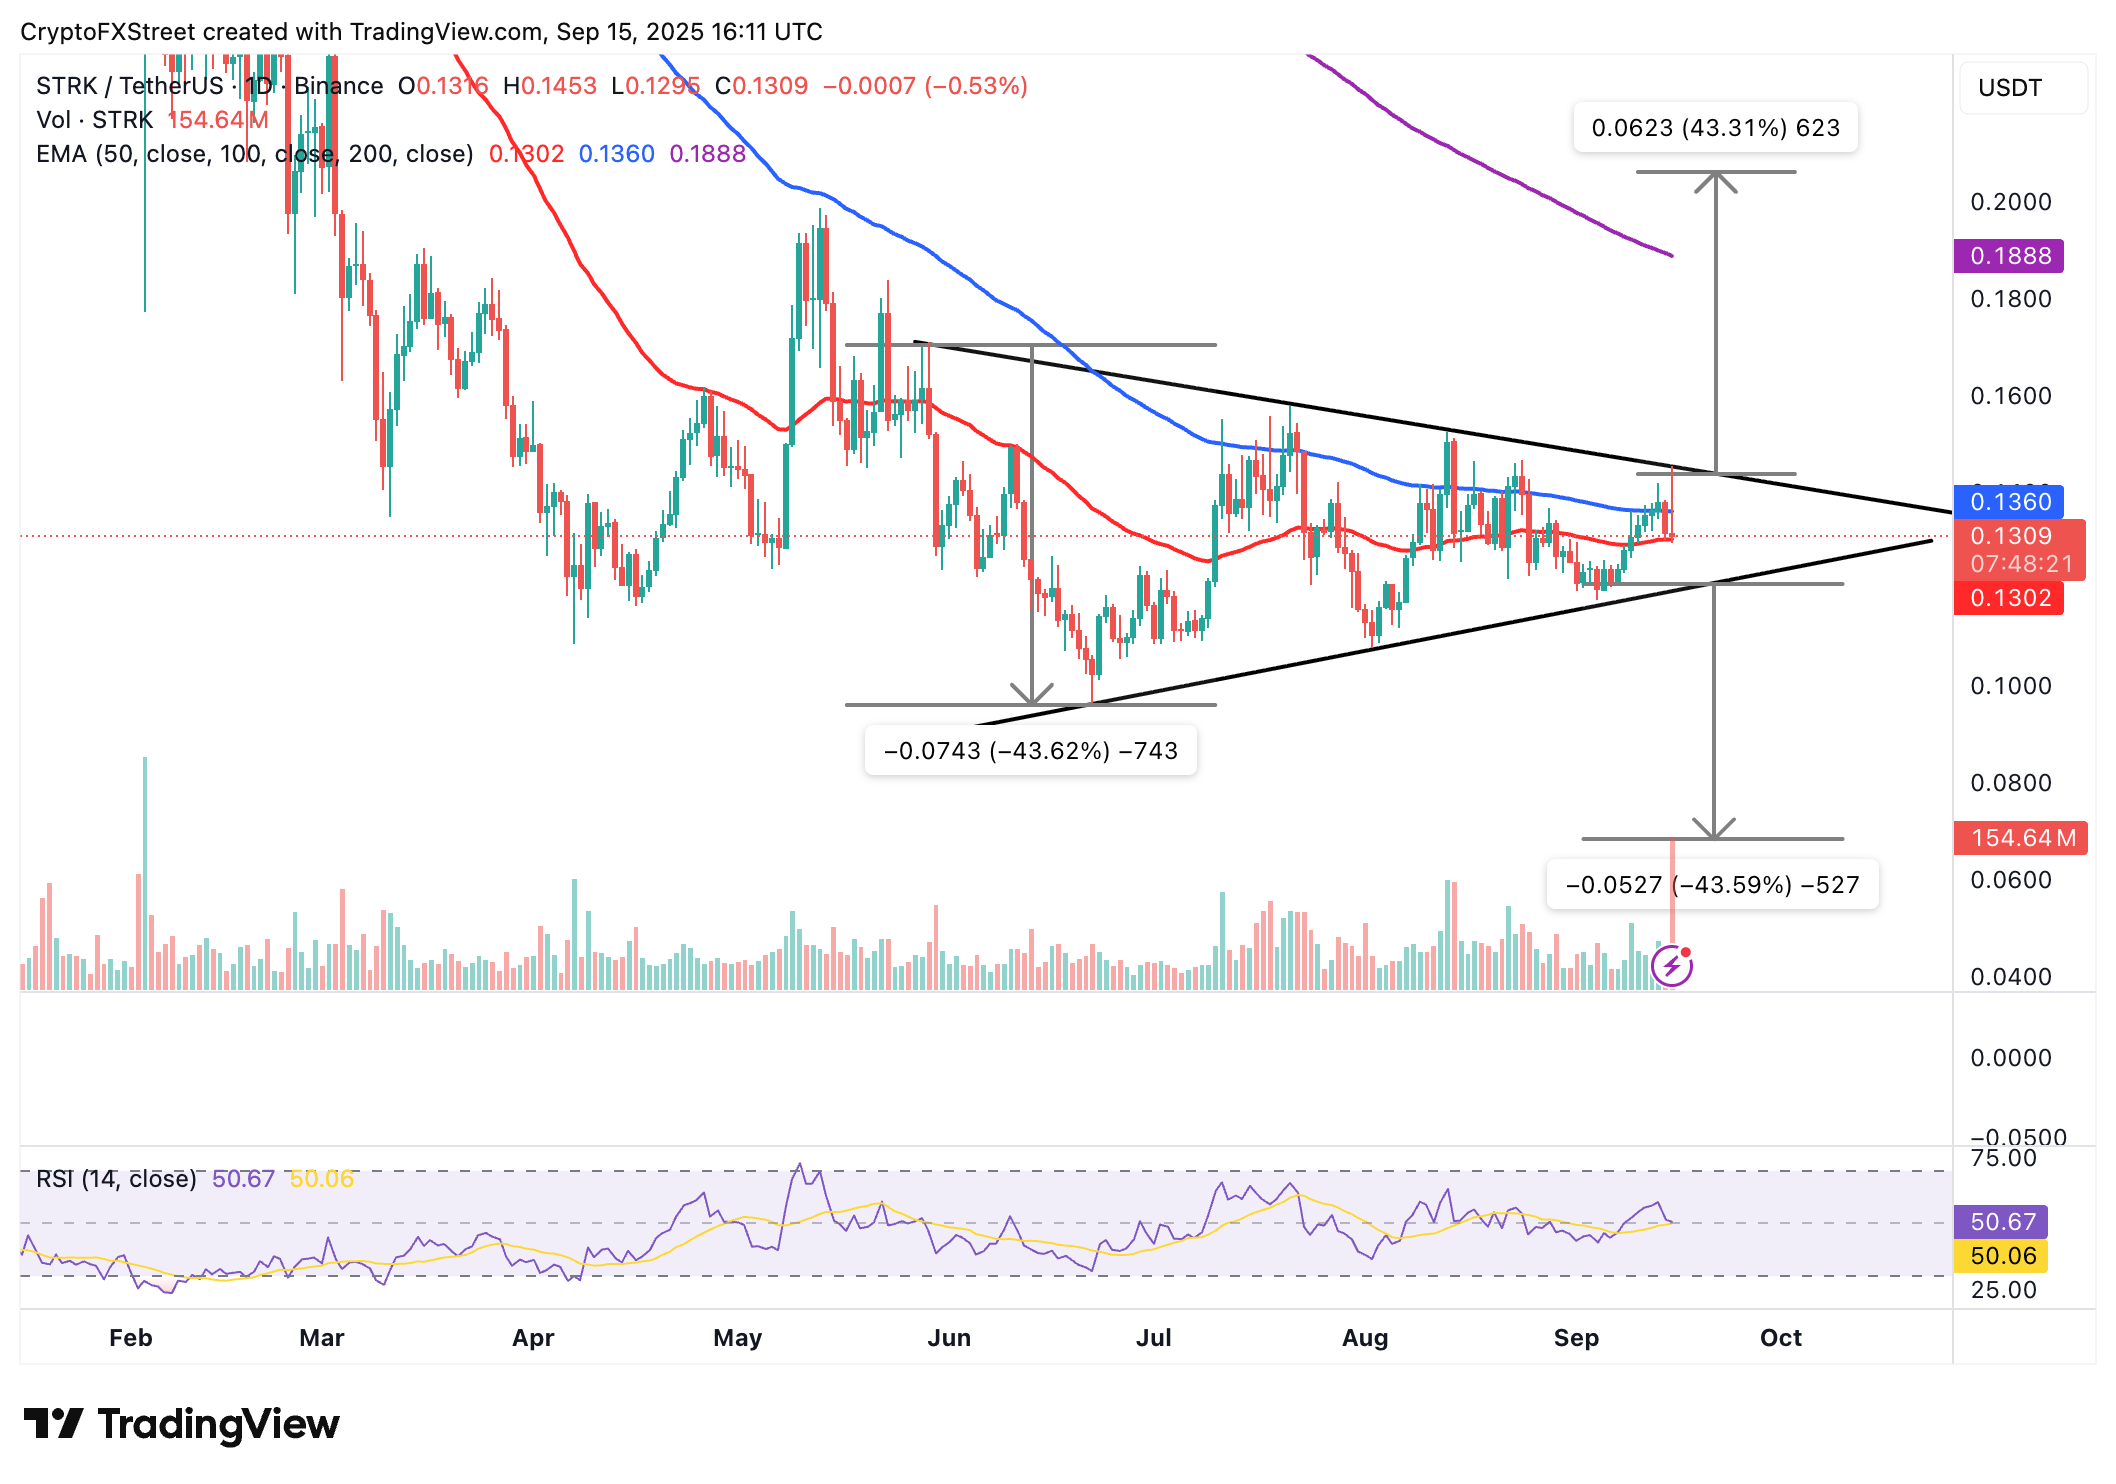
STRK/USDT daily chart
A symmetrical triangle pattern in the same daily time frame shows that Starknet is consolidating ahead of a potential breakout. Price action below the ascending trendline could trigger a 44% bearish breakout to $0.0683.
Still, Starknet has the potential to post a significant recovery above the triangle. Such a move would follow a breakout above the descending trendline, projecting a 44% move to $0.2061. This target is determined by measuring the distance between the triangle’s widest points, extrapolating above the breakout point, as shown on the daily chart above.
Cryptocurrency metrics FAQs
The developer or creator of each cryptocurrency decides on the total number of tokens that can be minted or issued. Only a certain number of these assets can be minted by mining, staking or other mechanisms. This is defined by the algorithm of the underlying blockchain technology. On the other hand, circulating supply can also be decreased via actions such as burning tokens, or mistakenly sending assets to addresses of other incompatible blockchains.
Market capitalization is the result of multiplying the circulating supply of a certain asset by the asset’s current market value.
Trading volume refers to the total number of tokens for a specific asset that has been transacted or exchanged between buyers and sellers within set trading hours, for example, 24 hours. It is used to gauge market sentiment, this metric combines all volumes on centralized exchanges and decentralized exchanges. Increasing trading volume often denotes the demand for a certain asset as more people are buying and selling the cryptocurrency.
Funding rates are a concept designed to encourage traders to take positions and ensure perpetual contract prices match spot markets. It defines a mechanism by exchanges to ensure that future prices and index prices periodic payments regularly converge. When the funding rate is positive, the price of the perpetual contract is higher than the mark price. This means traders who are bullish and have opened long positions pay traders who are in short positions. On the other hand, a negative funding rate means perpetual prices are below the mark price, and hence traders with short positions pay traders who have opened long positions.

FXStreet
Plus d’un million d’utilisateurs se tournent vers FXStreet pour des données de marché en temps réel, des outils de graphiques, des analyses d’experts et des actualités Forex. Leur calendrier économique complet et leurs webinaires éducatifs aident les traders à rester informés et à prendre des décisions éclairées. FXStreet s’appuie sur une équipe d’environ 60 professionnels répartis entre le siège de Barcelone et diverses régions du monde.
Read More


