


- Solana holds above $120 following a nearly 2% decline on Monday, risking further correction in a descending wedge pattern.
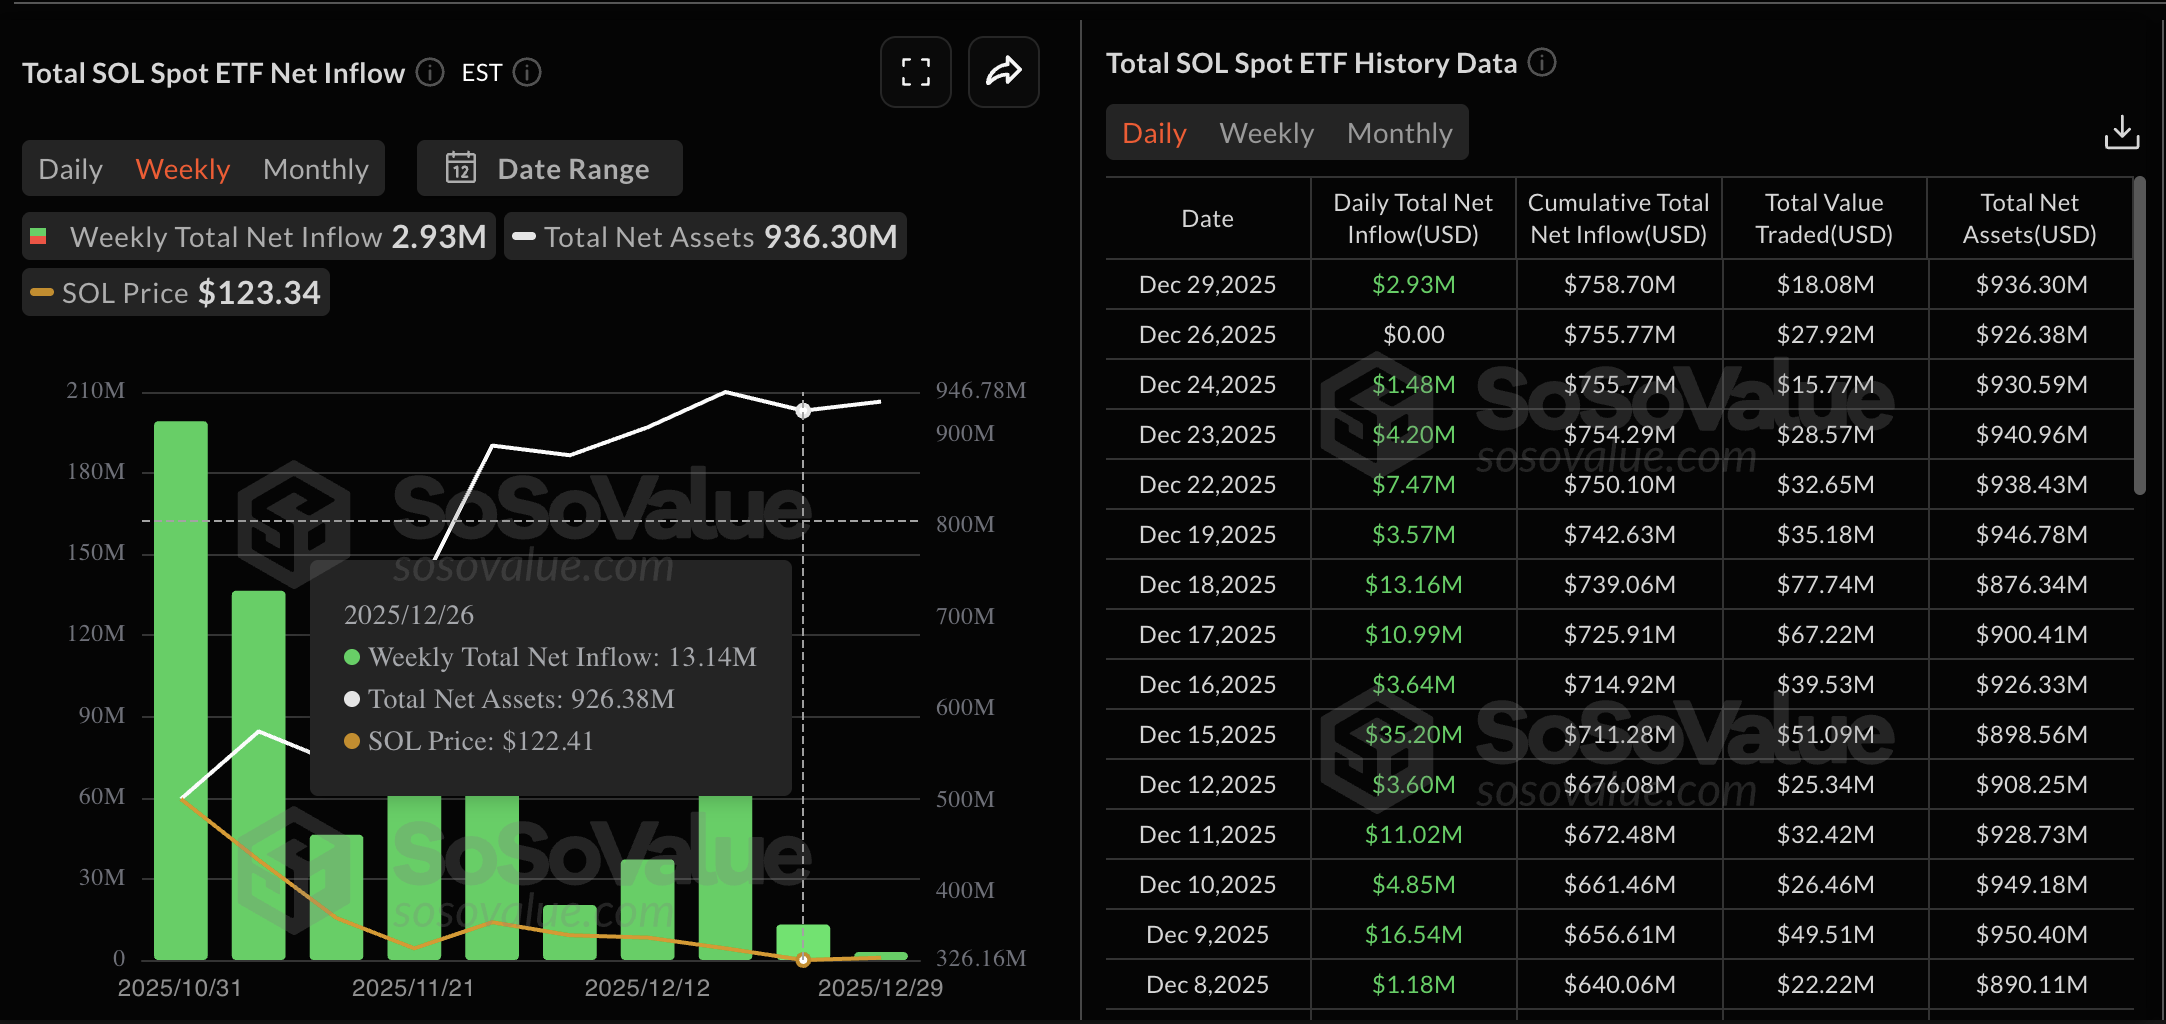
- Institutional confidence in Solana remains steady as ETFs extend their streak with a $2.93 million inflow on Monday.
- Derivatives data reveals fresh capital inflow amid rising bearish bets, indicating a sell-side dominance.
Solana (SOL) hovers above $120 at press time on Tuesday after a nearly 2% decline on Monday. The SOL-focused Exchange Traded Funds (ETFs) see renewed interest after recording their lowest weekly inflow last week. However, the derivatives data indicates a sell-side inclination in traders' sentiment amid rising SOL futures Open Interest.
Institutions bag SOL as retail sentiment falters
Solana ETFs recorded their lowest weekly collection of $13.14 million, down from $66.55 million the previous week, suggesting lower institutional interest amid broader cryptocurrency market volatility. Still, an inflow of $2.93 million on Monday, after a net-zero flow on Friday, reflects steady demand.
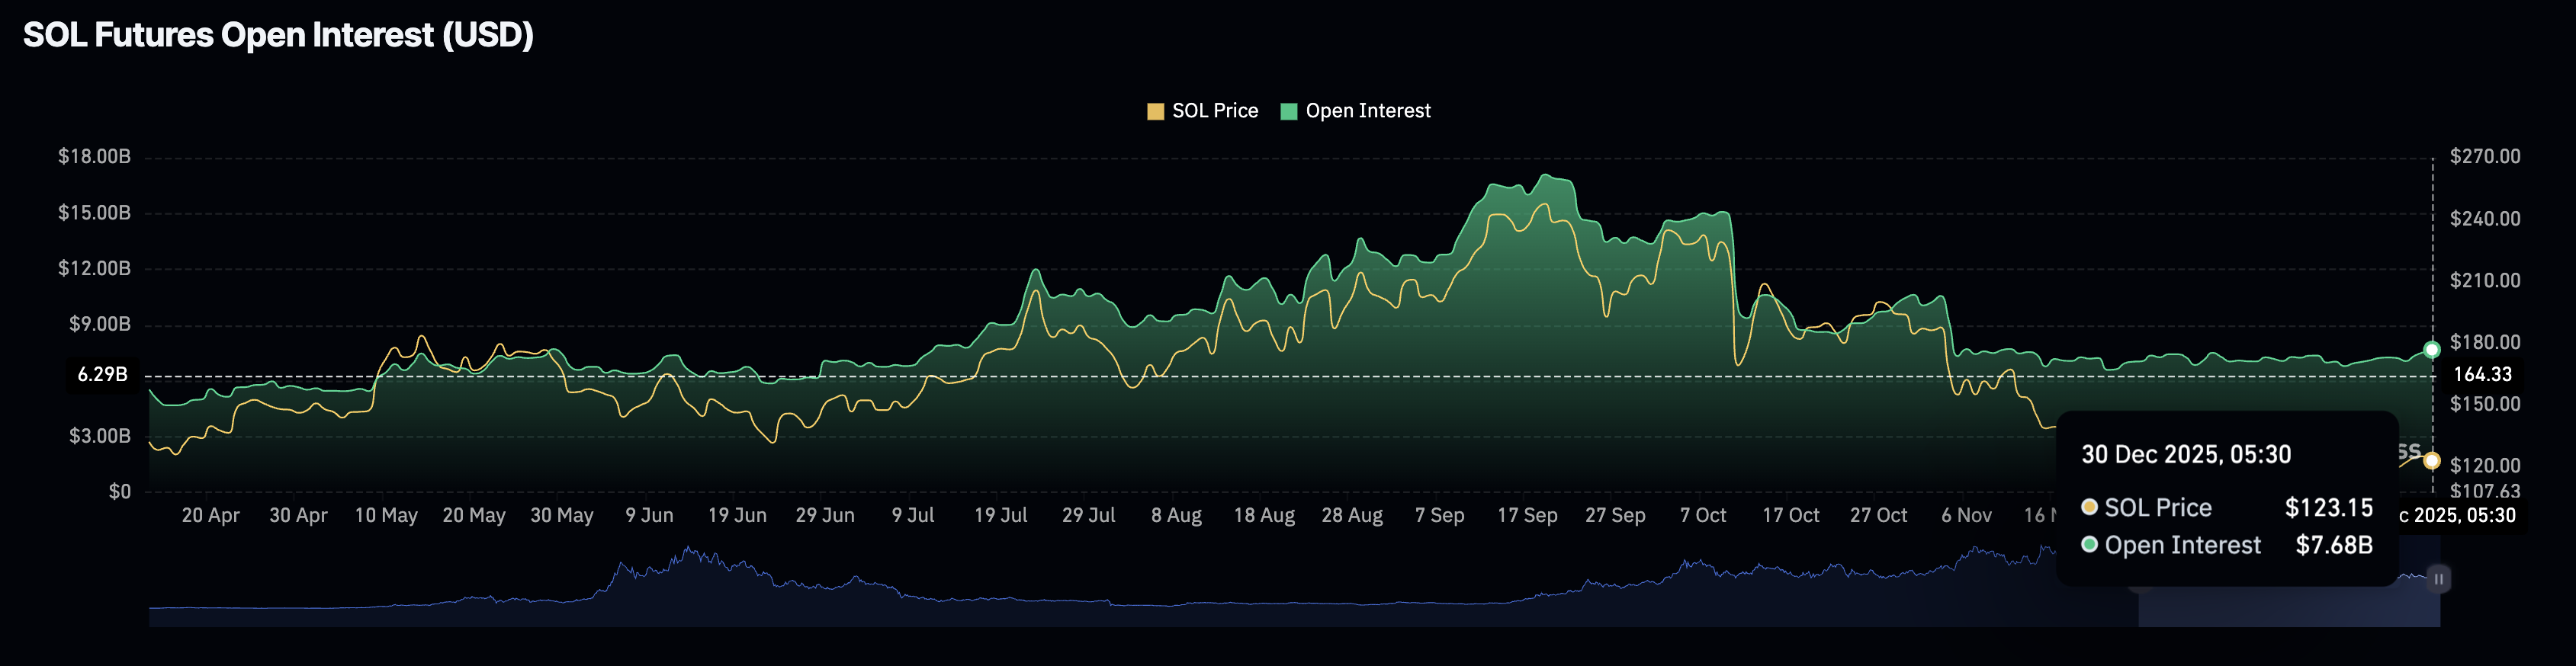
On the derivatives side, retail sentiment inclines to a sell-side strategy. CoinGlass data shows that the SOL futures Open Interest (OI) – total notional value of active positions – is at $7.68 billion on Monday, up from $7.54 billion on the previous day. This suggests that traders are pouring fresh capital into Solana derivatives.
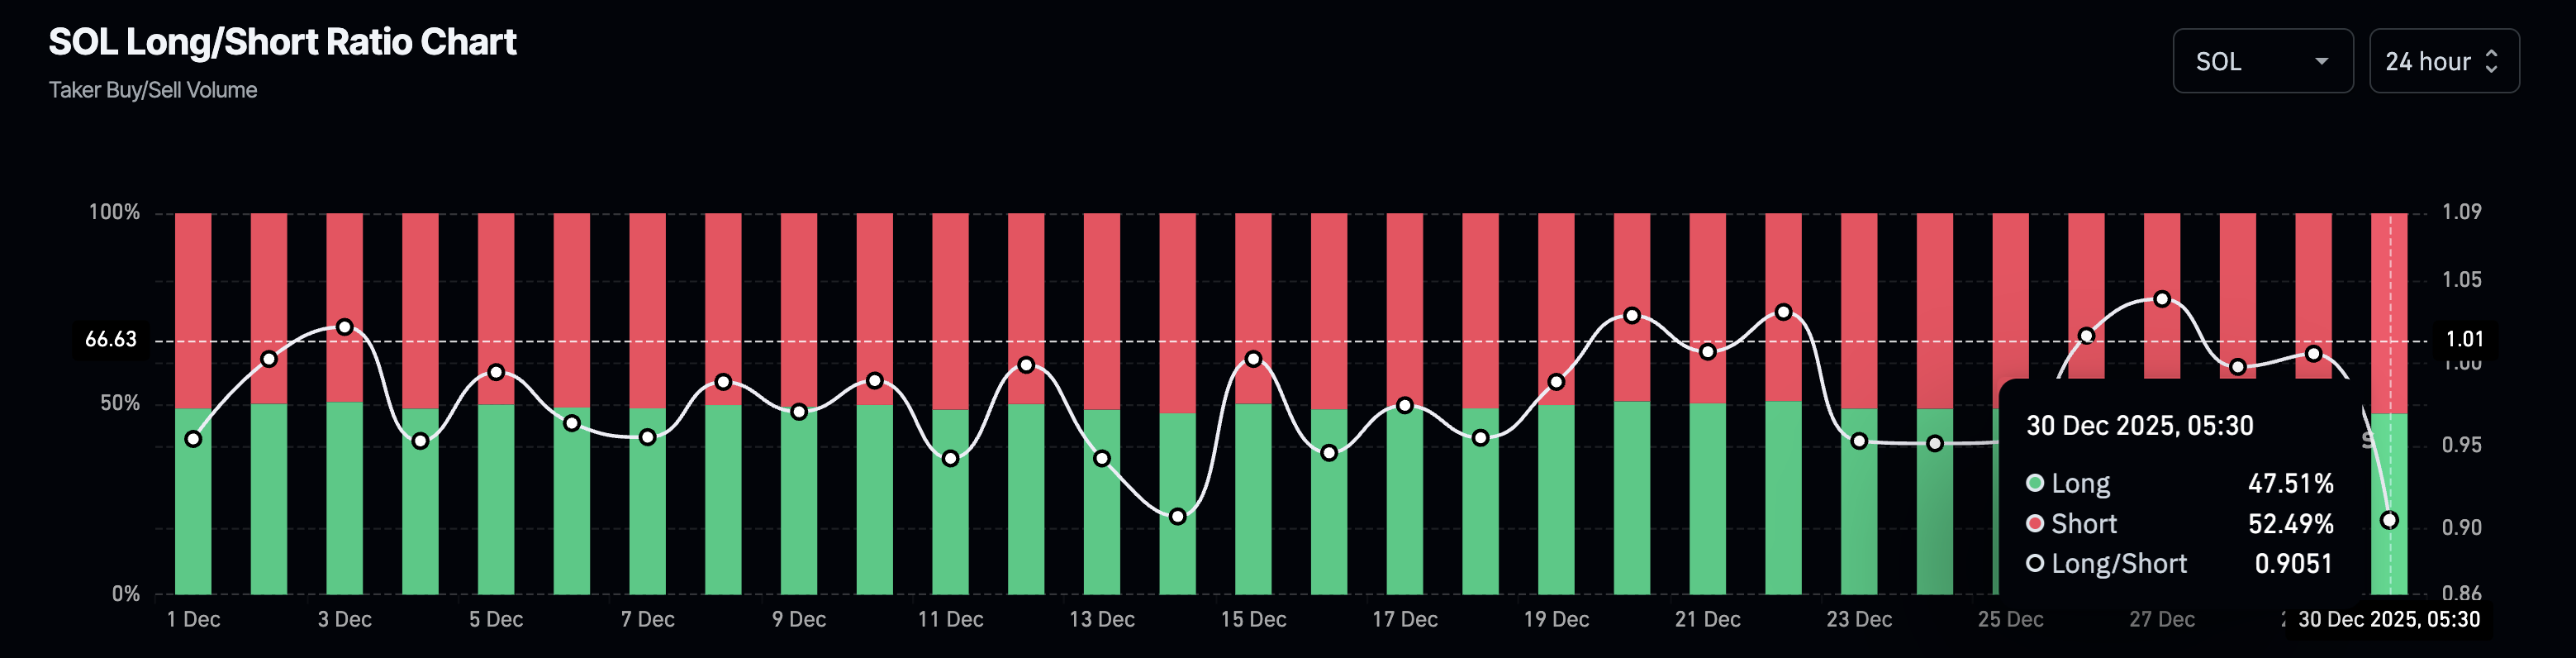
However, the long-to-short ratio reflects a bearish bias in active positions, suggesting that capital inflows may have fueled the short positional buildup. The short positions account for 52.49%, up from 49.85% over the last 24 hours.
Technical outlook: Could Solana bounce back?
Solana hovers near $120 within a descending wedge pattern formed by two converging trendlines on the daily chart. The reversal from $130 on Monday, which led to an almost 2% decline, risks a steeper correction toward the support trendline connecting the November 21 and December 18 lows, near $115.
If SOL drops below $115, it could test the S1 Pivot Point at $107, which serves as support, above the April 7 low at $95.
The momentum indicators on the daily chart remain mixed as Solana fluctuates between $120 and $125. The Relative Strength Index (RSI) at 41 extends a sideways trend below the 50% mark, indicating persistent bearish pressure.
At the same time, the Moving Average Convergence Divergence (MACD) bounces off the signal line toward the zero line, suggesting a boost in bullish momentum.
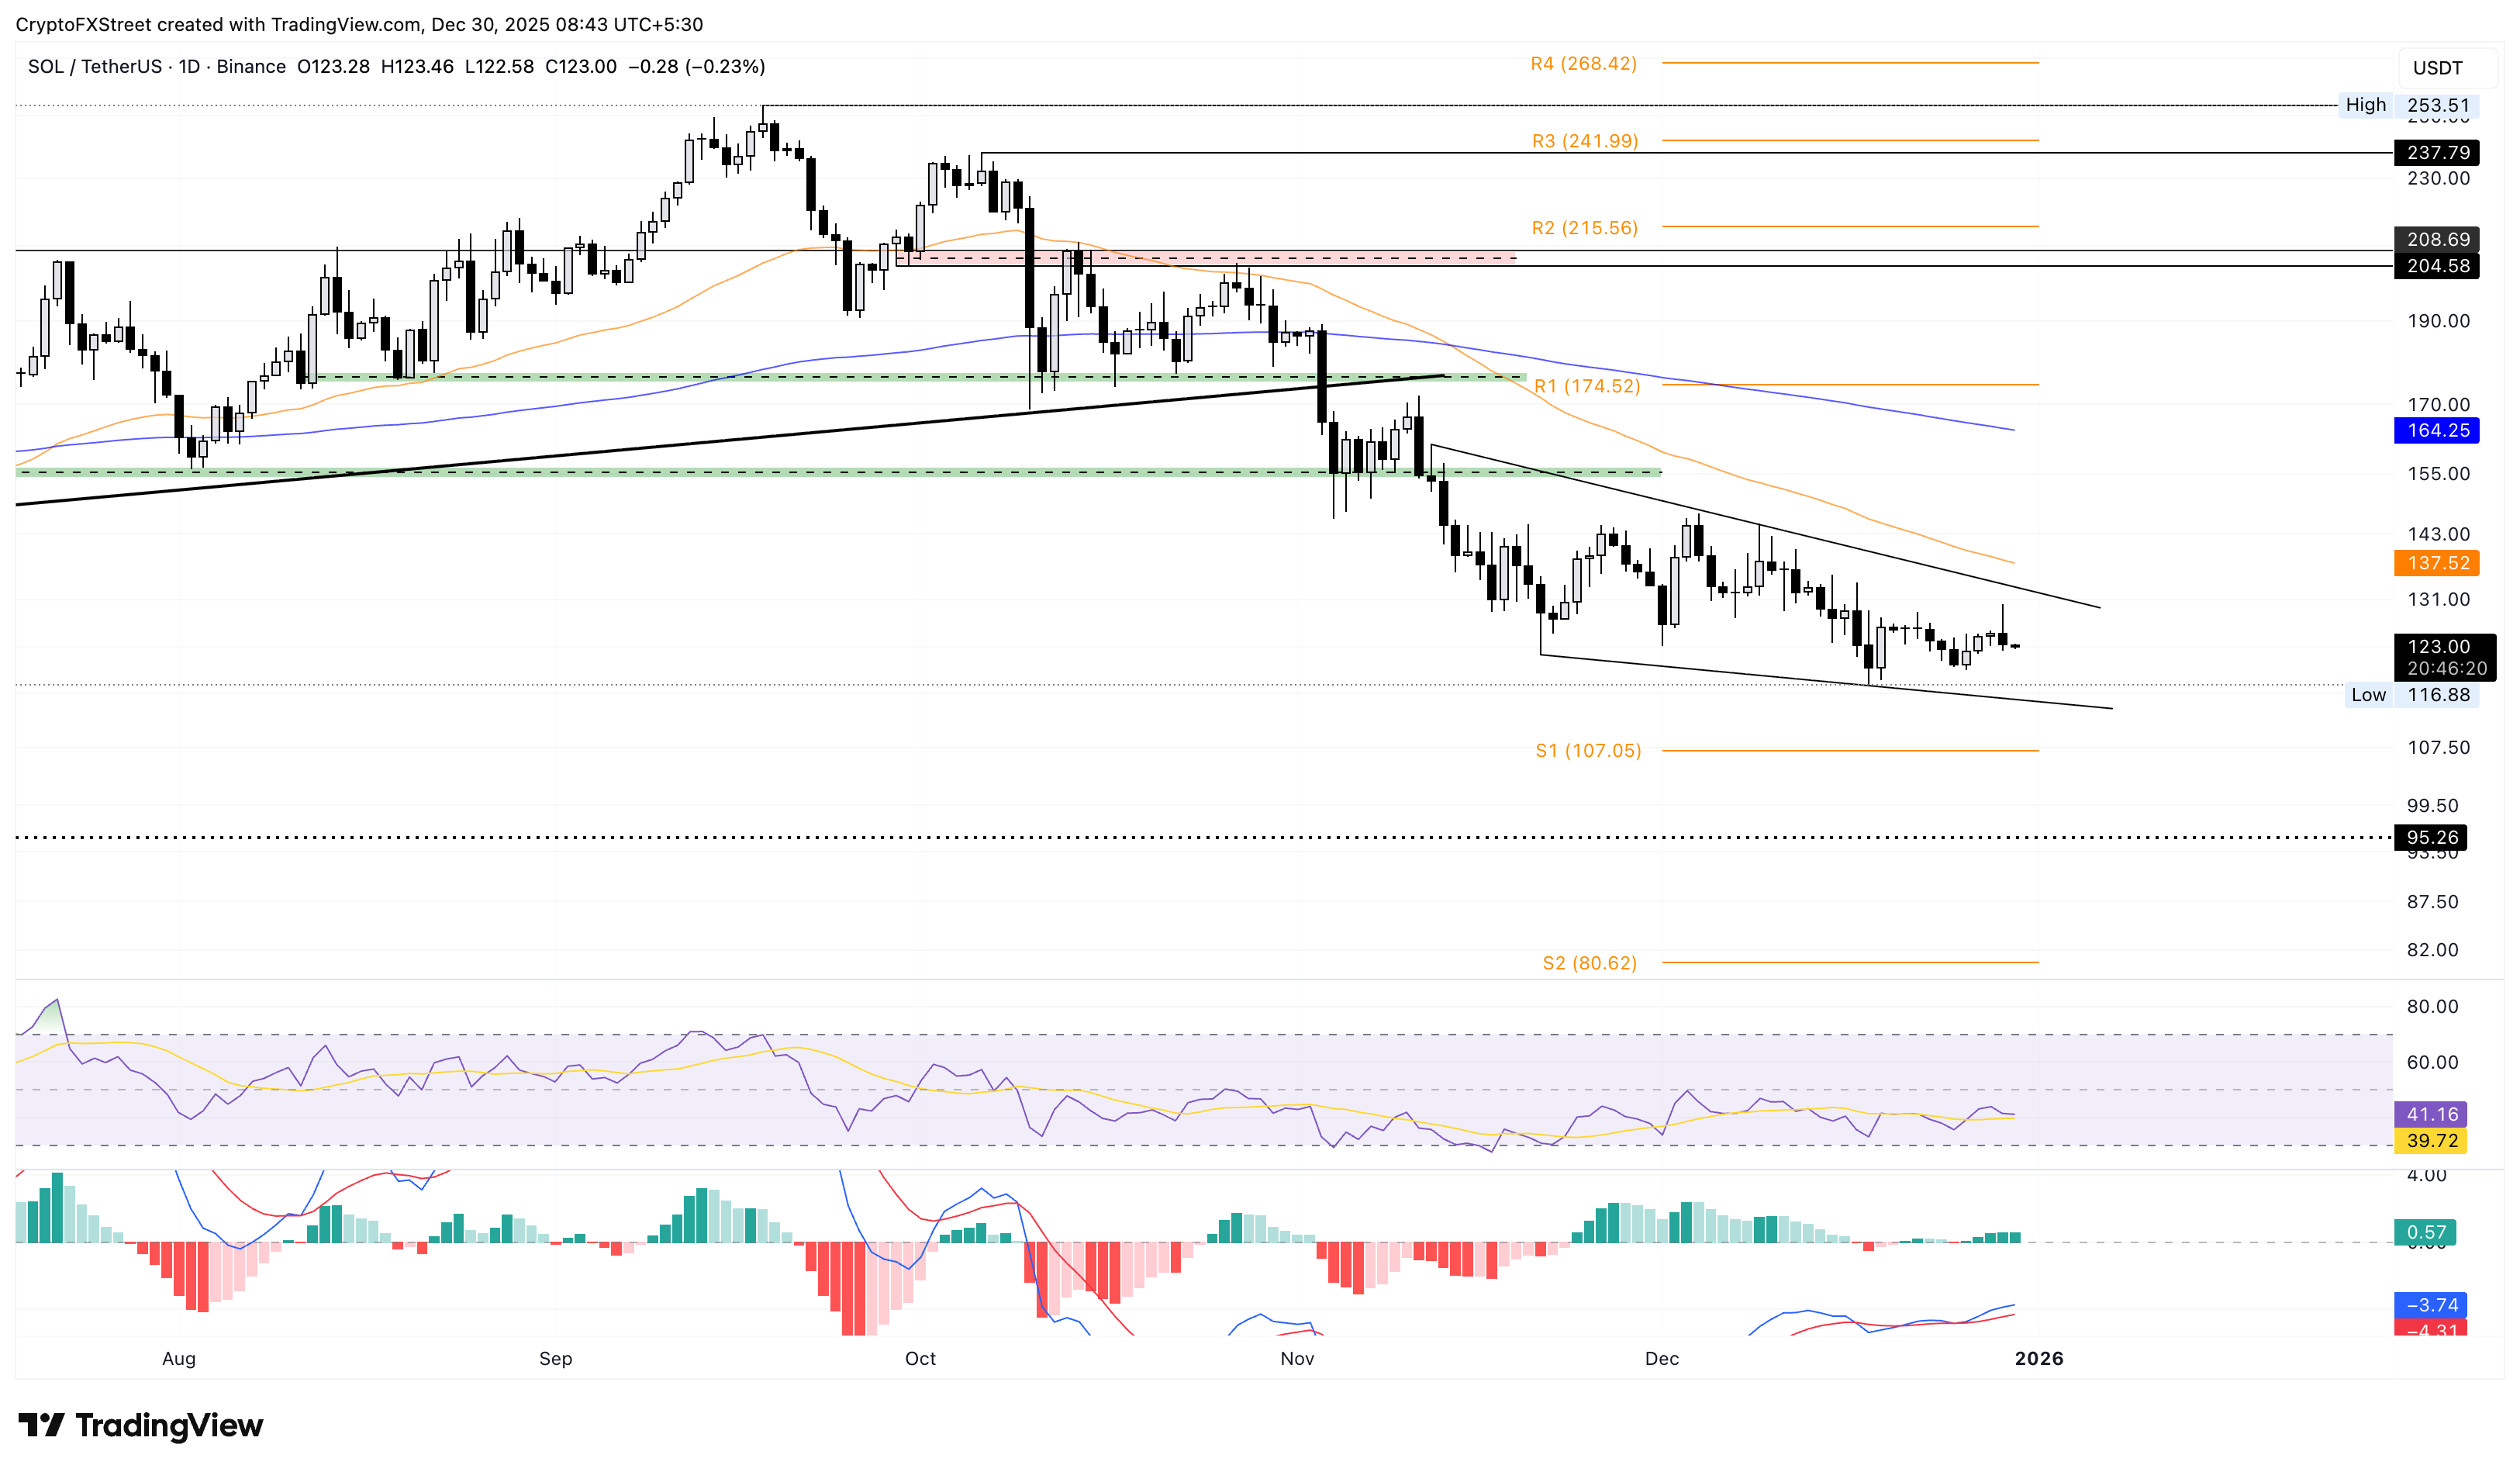
Looking up, if SOL exceeds the overhead trendline, connecting the November 12 and December 9 highs, near $133, it could test the 50-day Exponential Moving Average (EMA) at $137.


