
The Sandbox Price Forecast: SAND extends gains, as whale accumulation accelerates
Par Manish Chhetri
Date de publication: 21 Jan 2026 | Date de modification: 21 Jan 2026


ARTICLES POPULAIRES

The Sandbox (SAND) price rose more than 7%, trading above $0.147 on Wednesday after finding support at the key level the previous day. The bullish price action is further supported by whale accumulation and rising Open Interest (OI).
- The Sandbox extends gains on Wednesday after rebounding from the 50-day EMA at $0.134 the previous day.
- On-chain data and derivatives point to a bullish picture, with whales accumulating SAND and open interest rising.
- The technical outlook suggests rally continuation, with bulls aiming for levels above $0.160.
The Sandbox (SAND) price rose more than 7%, trading above $0.147 on Wednesday after finding support at the key level the previous day. The bullish price action is further supported by whale accumulation and rising Open Interest (OI). On the technical side, bulls are aiming for a further rally, targeting levels above $0.160.
Whales buy SAND at price dips
Santiment’s Supply Distribution data supports a bullish outlook for The Sandbox, as certain whales are buying SAND at recent price dips.
The metric indicates that whales holding between 10 million and 100 million SAND tokens (blue line) and 100,000 and 1 million SAND tokens (red line) have accumulated a total of 94.39 million tokens from January 15 to Wednesday. During the same period, wallets holding between 1 million and 10 million SAND tokens (yellow line) have shed 14.87 million tokens.
This shows that the second cohort of whales could have fallen prey to the capitulation event. In contrast, the first set of wallets seized the opportunity and accumulated SAND at a discount.
 [09-1768974451563-1768974451564.04.54, 21 Jan, 2026].png)
In addition, CryptoQuant's Exchange Netflow metric for SAND shows three red bars since Sunday, indicating that holders are removing tokens from exchanges and reducing selling pressure, supporting the bullish view.
 - All Exchanges-1768974483919-1768974483919.png)
The Sandbox rising open interest, growing investors' interest
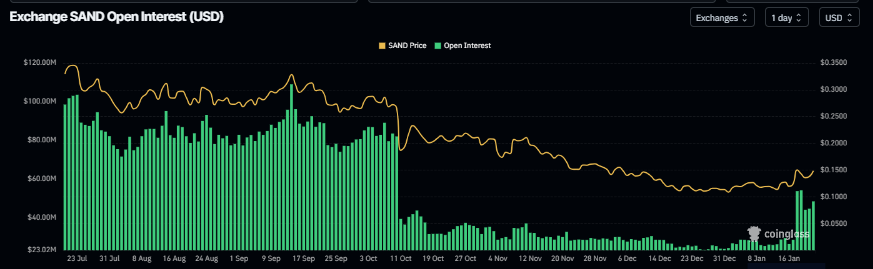
On the derivatives side, CoinGlass’s data also projects a bullish bias. As the chart shows, SAND futures OI at exchanges rose to $54.07 million on Monday, up from $26.28 million on Friday, and has since remained steady. Rising OI represents new or additional money entering the market and new buying, which could fuel the current SAND price rally.
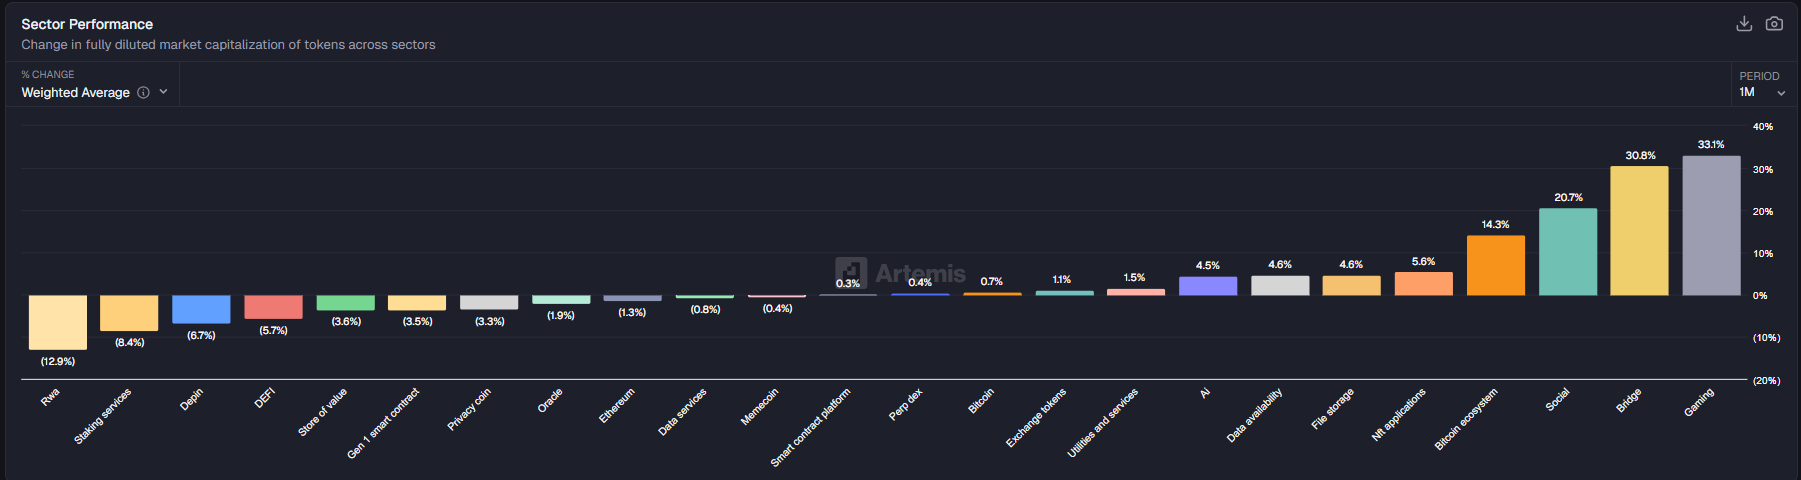
Moreover, gaming-focused coins such as The Sandbox, Axie Infinity (AXS) and Decentraland (MANA) have started the year on a strong footing, collectively gaining around 33.1% so far this month, signaling renewed investor interest in the space.
The Sandbox Price Forecast: SAND bulls are aiming for levels above $0.160
The Sandbox price rose more than 20% on Saturday, but faced rejection at the 100-day Exponential Moving Average (EMA) at $0.159, and then declined 9.71% over the next two days. On Tuesday, SAND rebounded slightly after retesting its 50-day EMA at $0.134. As of writing on Wednesday, SAND is trading 7% higher at $0.148.
If SAND continues its upward trend, it could extend the rally toward the 100-day EMA at $0.159. A successful close above this level could extend additional gains toward the daily resistance level at $0.187.
The Relative Strength Index (RSI) on the daily chart reads 62, above the neutral level of 50, indicating bullish momentum gaining traction. The Moving Average Convergence Divergence (MACD) also showed a bullish crossover, which remains intact with rising green histogram bars further supporting the bullish view.
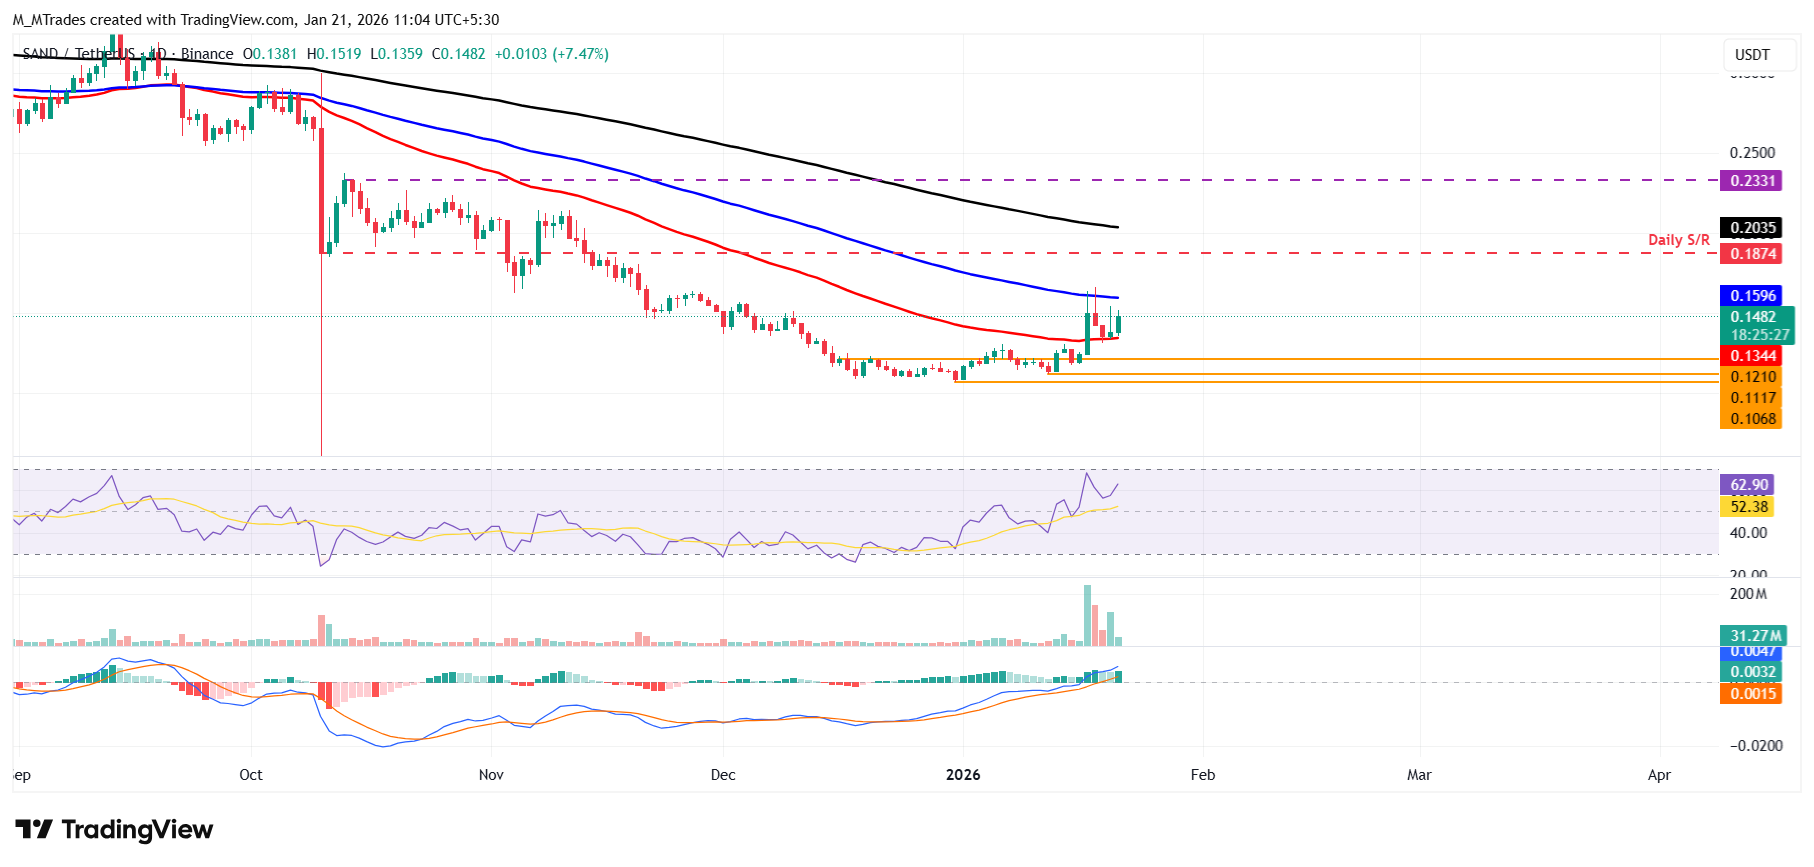
However, if SAND faces a correction, it could extend the decline toward the 50-day EMA at $0.134.

Plus d’un million d’utilisateurs se tournent vers FXStreet pour des données de marché en temps réel, des outils de graphiques, des analyses d’experts et des actualités Forex. Leur calendrier économique complet et leurs webinaires éducatifs aident les traders à rester informés et à prendre des décisions éclairées. FXStreet s’appuie sur une équipe d’environ 60 professionnels répartis entre le siège de Barcelone et diverses régions du monde.
Lire la suite


