
Trade The World
Top 3 Price Prediction: Bitcoin, Ethereum, Ripple – BTC, ETH and XRP correction slide as BoJ rate decision weighs on sentiment
Par Manish Chhetri
Date de publication: 19 Dec 2025 | Date de modification: 19 Dec 2025


POPULAR ARTICLES

Bitcoin (BTC), Ethereum (ETH), and Ripple (XRP) are extending their correction phases after losing nearly 3%, 8%, and 10%, respectively, through Friday.
- Bitcoin price closes below the key support at $85,569, signaling a risk of a deeper corrective move.
- Ethereum price trades below $2,900 on Friday after losing nearly 8% so far this week.
- XRP continues to weaken, slipping to a two-month low near $1.78 amid persistent selling pressure.
Bitcoin (BTC), Ethereum (ETH), and Ripple (XRP) are extending their correction phases after losing nearly 3%, 8%, and 10%, respectively, through Friday. The pullback phase is further strengthened as the upcoming Bank of Japan’s (BoJ) rate decision on Friday weighs on risk sentiment, with BTC breaking key support, ETH deepening weekly losses, and XRP sliding to multi-month lows.
As explained in the previous report, Bitcoin has historically declined following BoJ rate hikes, falling 27% after the March 2024 decision, 30% after the July 2024 hike, and 30% after the January 2025 hike, showing a consistent pattern of sharp pullbacks after BoJ policy tightening.
If historical patterns repeat following Friday’s rate decision, Bitcoin may echo its previous post-policy reaction, potentially dragging Ethereum and XRP into a deeper corrective move.
Bitcoin could extend its correction as it closes below key support
Bitcoin was rejected at the psychological $90,000 resistance on Monday but found support at the 78.6% Fibonacci retracement at $85,569, leading to consolidation between these levels until Wednesday. However, on Thursday BTC declined and closed below the $85,569 level. At the time of writing on Friday, it trades around $85,300.
If BTC continues its downtrend, it could extend the decline toward the psychological $80,000 level.
The Relative Strength Index (RSI) on the daily chart is at 36, below its neutral level of 50, indicating bearish momentum gaining traction. Moreover, the Moving Average Convergence Divergence (MACD) showed a bearish crossover on Wednesday, further supporting the bearish view.
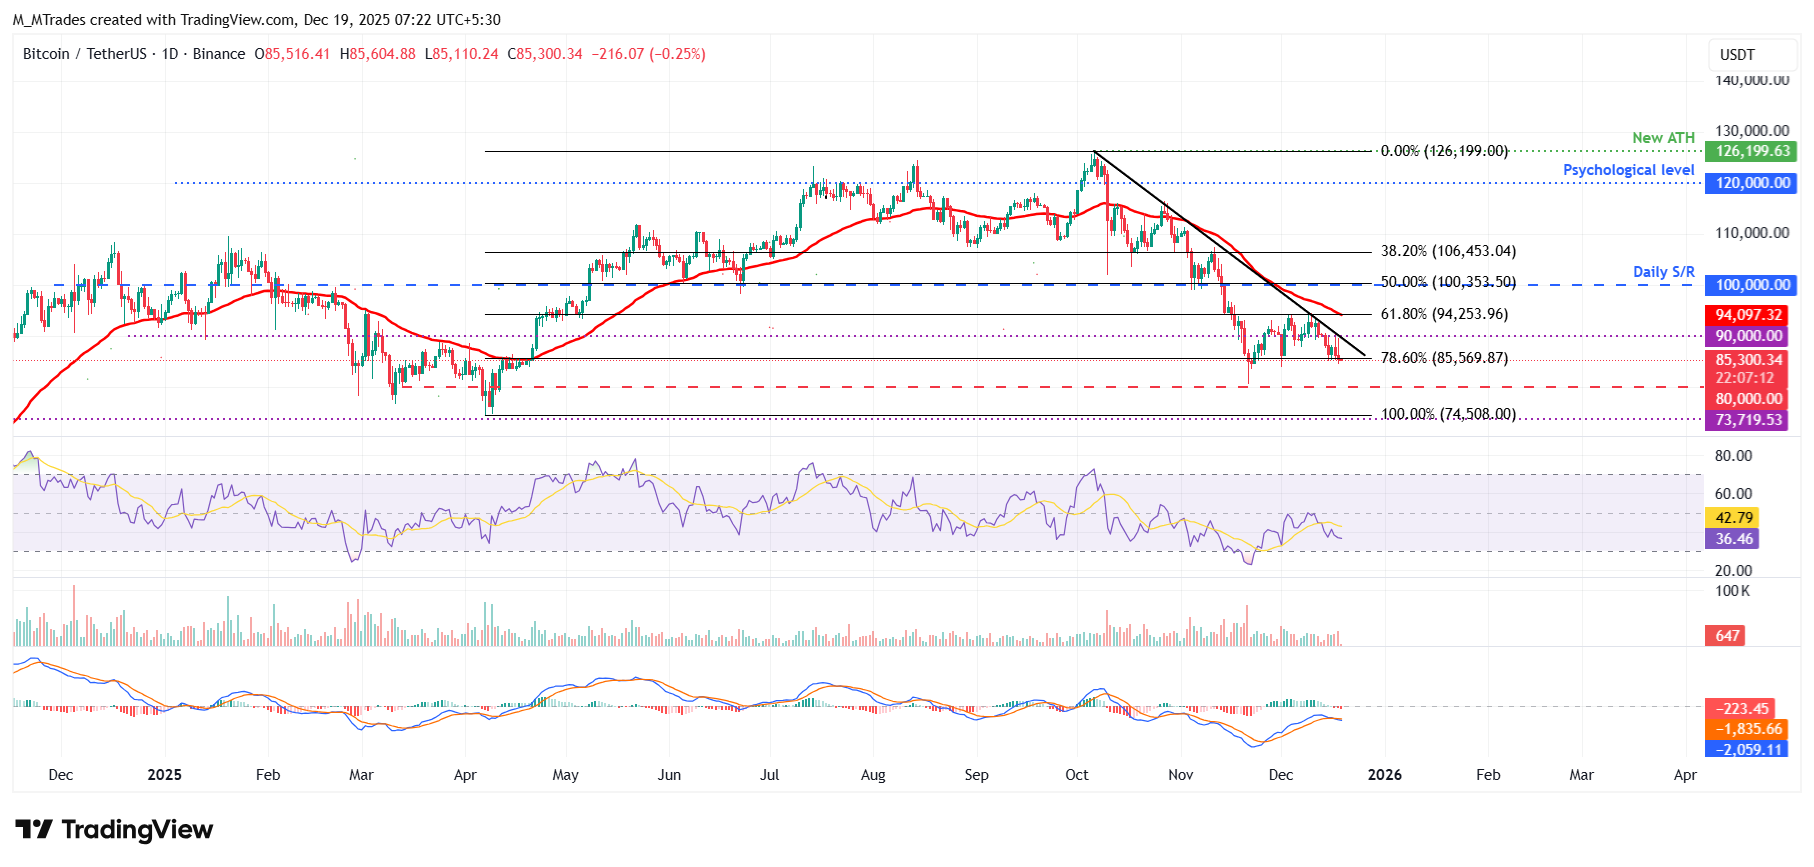
Looking up, if BTC recovers, it could extend its advance toward the key resistance level at $90,000.
Ethereum could extend its decline if it closes below $2,750
Ethereum price failed to close above the 50-day Exponential Moving Average (EMA) at $3,249 on December 10 and declined 15% by Thursday. At the time of writing on Friday, ETH is approaching its 61.8% Fibonacci retracement level at $2,749.
If ETH closes below $2,749 on a daily basis, it could extend the decline toward the next support at $2,500.
The RSI on the daily chart is 37, below its neutral level of 50, indicating that bearish momentum is gaining traction. Moreover, the MACD is showing a bearish crossover on Wednesday, further supporting the negative outlook.
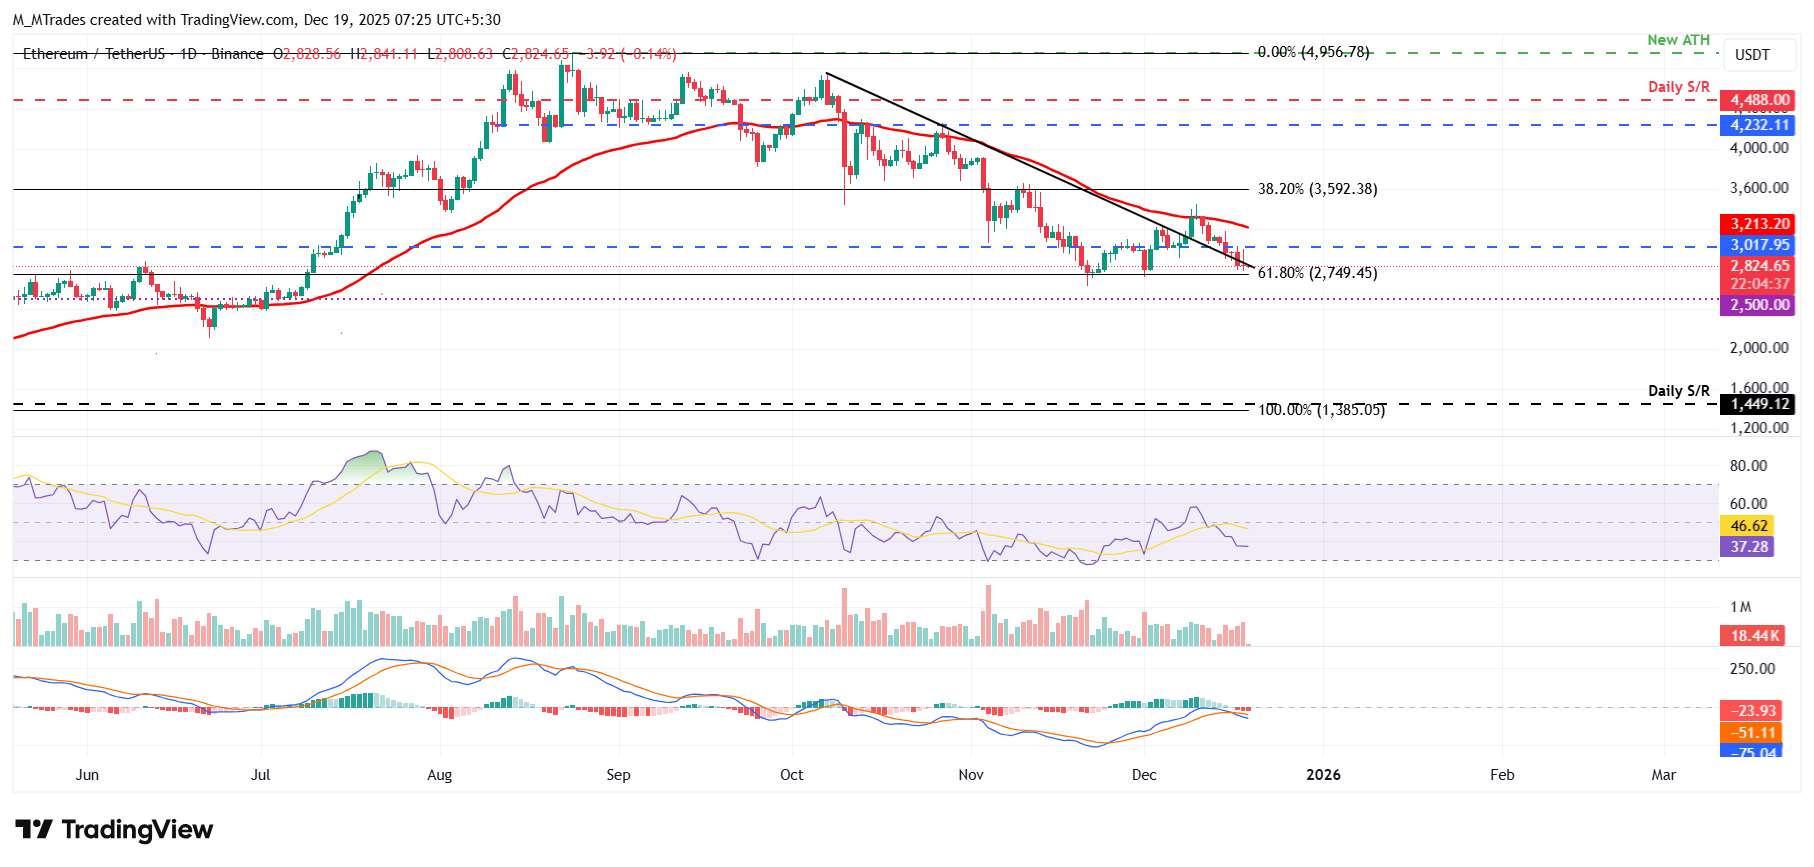
On the other hand, if ETH recovers, it could extend gains toward the daily resistance at $3,017.
XRP hits a two-month low
XRP price declined for the second consecutive week by 3.22%, retesting the key daily support at $1.96 on Sunday. As of this week, on Monday, XRP continued its correction, closing below this support level and declining by 8.48% by Thursday. As of Friday, XRP declined, reaching a two-month low of $1.78.
If XRP continues its pullback, it could extend the decline toward the weekly support at $1.30.
The RSI on the daily chart is 30, nearing the oversold conditions, indicating strong bearish momentum. Additionally, the MACD indicator also showed a bearish crossover on Sunday, which remains intact, further supporting the bearish thesis.
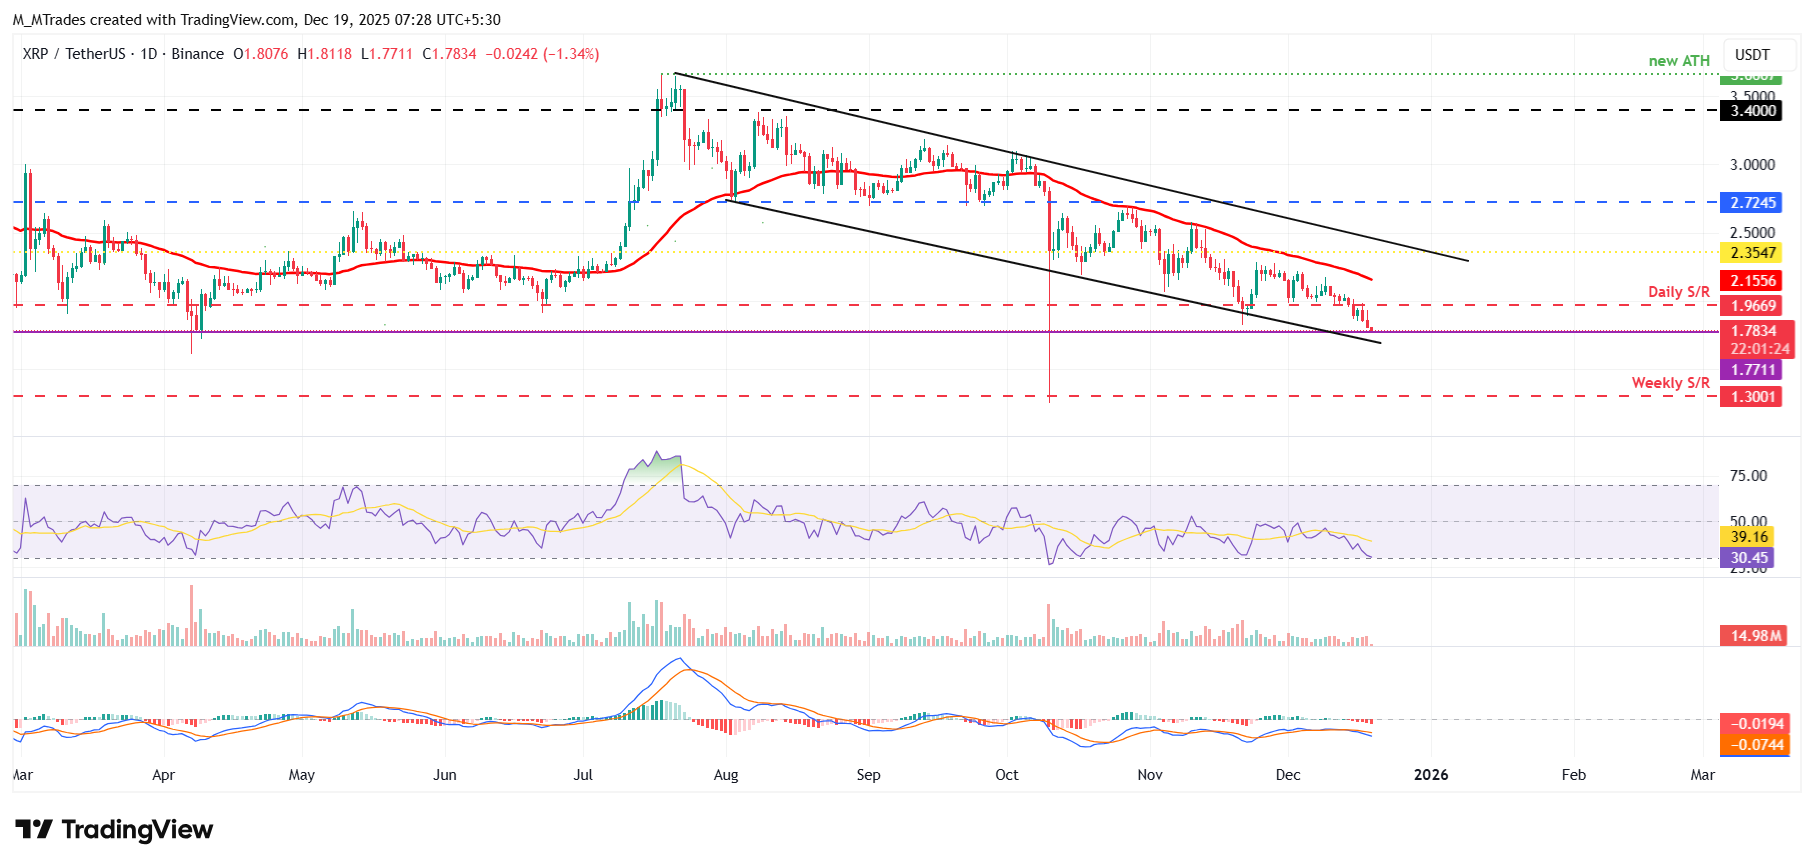
However, if XRP recovers, it could extend the advance toward the daily resistance level at $1.96.
Cryptocurrency metrics FAQs
The developer or creator of each cryptocurrency decides on the total number of tokens that can be minted or issued. Only a certain number of these assets can be minted by mining, staking or other mechanisms. This is defined by the algorithm of the underlying blockchain technology. On the other hand, circulating supply can also be decreased via actions such as burning tokens, or mistakenly sending assets to addresses of other incompatible blockchains.
Market capitalization is the result of multiplying the circulating supply of a certain asset by the asset’s current market value.
Trading volume refers to the total number of tokens for a specific asset that has been transacted or exchanged between buyers and sellers within set trading hours, for example, 24 hours. It is used to gauge market sentiment, this metric combines all volumes on centralized exchanges and decentralized exchanges. Increasing trading volume often denotes the demand for a certain asset as more people are buying and selling the cryptocurrency.
Funding rates are a concept designed to encourage traders to take positions and ensure perpetual contract prices match spot markets. It defines a mechanism by exchanges to ensure that future prices and index prices periodic payments regularly converge. When the funding rate is positive, the price of the perpetual contract is higher than the mark price. This means traders who are bullish and have opened long positions pay traders who are in short positions. On the other hand, a negative funding rate means perpetual prices are below the mark price, and hence traders with short positions pay traders who have opened long positions.

FXStreet
Plus d’un million d’utilisateurs se tournent vers FXStreet pour des données de marché en temps réel, des outils de graphiques, des analyses d’experts et des actualités Forex. Leur calendrier économique complet et leurs webinaires éducatifs aident les traders à rester informés et à prendre des décisions éclairées. FXStreet s’appuie sur une équipe d’environ 60 professionnels répartis entre le siège de Barcelone et diverses régions du monde.
Read More


