
Trade The World
Top 3 Price Prediction: Bitcoin, Ethereum, Ripple – BTC, ETH, and XRP eye deeper correction as momentum continues to weaken
Par Manish Chhetri
Date de publication: 3 Nov 2025 | Date de modification: 3 Nov 2025


POPULAR ARTICLES

Bitcoin (BTC) price edges below $109,000 at the time of writing on Monday, down 3.51% over the previous week. Ethereum (ETH) and Ripple (XRP) prices are near their key support levels, and a decisive close below could trigger a steeper decline.
- Bitcoin price slips below $109,000 on Monday, following a 3.51% decline the previous week.
- Ethereum is correcting toward the $3,590 support level, a daily close below this mark could trigger a steeper decline.
- XRP nears key support at $2.35, a close below this level could accelerate the correction further.
Bitcoin (BTC) price edges below $109,000 at the time of writing on Monday, down 3.51% over the previous week. Ethereum (ETH) and Ripple (XRP) prices are near their key support levels, and a decisive close below could trigger a steeper decline. The momentum indicators for these top cryptocurrencies continue to weaken, suggesting a further correction this week.
Bitcoin shows weakness in momentum
Bitcoin price faced rejection at the 78.6% Fibonacci retracement level (drawn from the April 7 low of $74,508 to the October 6 all-time high of $126,199) at $115,137 last week, and declined 3.51%. At the time of writing on Monday, BTC is trading down around $109,000.
If BTC continues its correction and closes below the 61.8% Fibonacci retracement level at $106,453, it could extend the decline toward the October 10 low of $102,000.
The Relative Strength Index (RSI) on the daily chart reads 43, below the neutral level of 50, indicating bearish momentum gaining traction. The Moving Average Convergence Divergence (MACD) lines are also converging, with decreasing green histogram bars signaling fading bullish momentum.
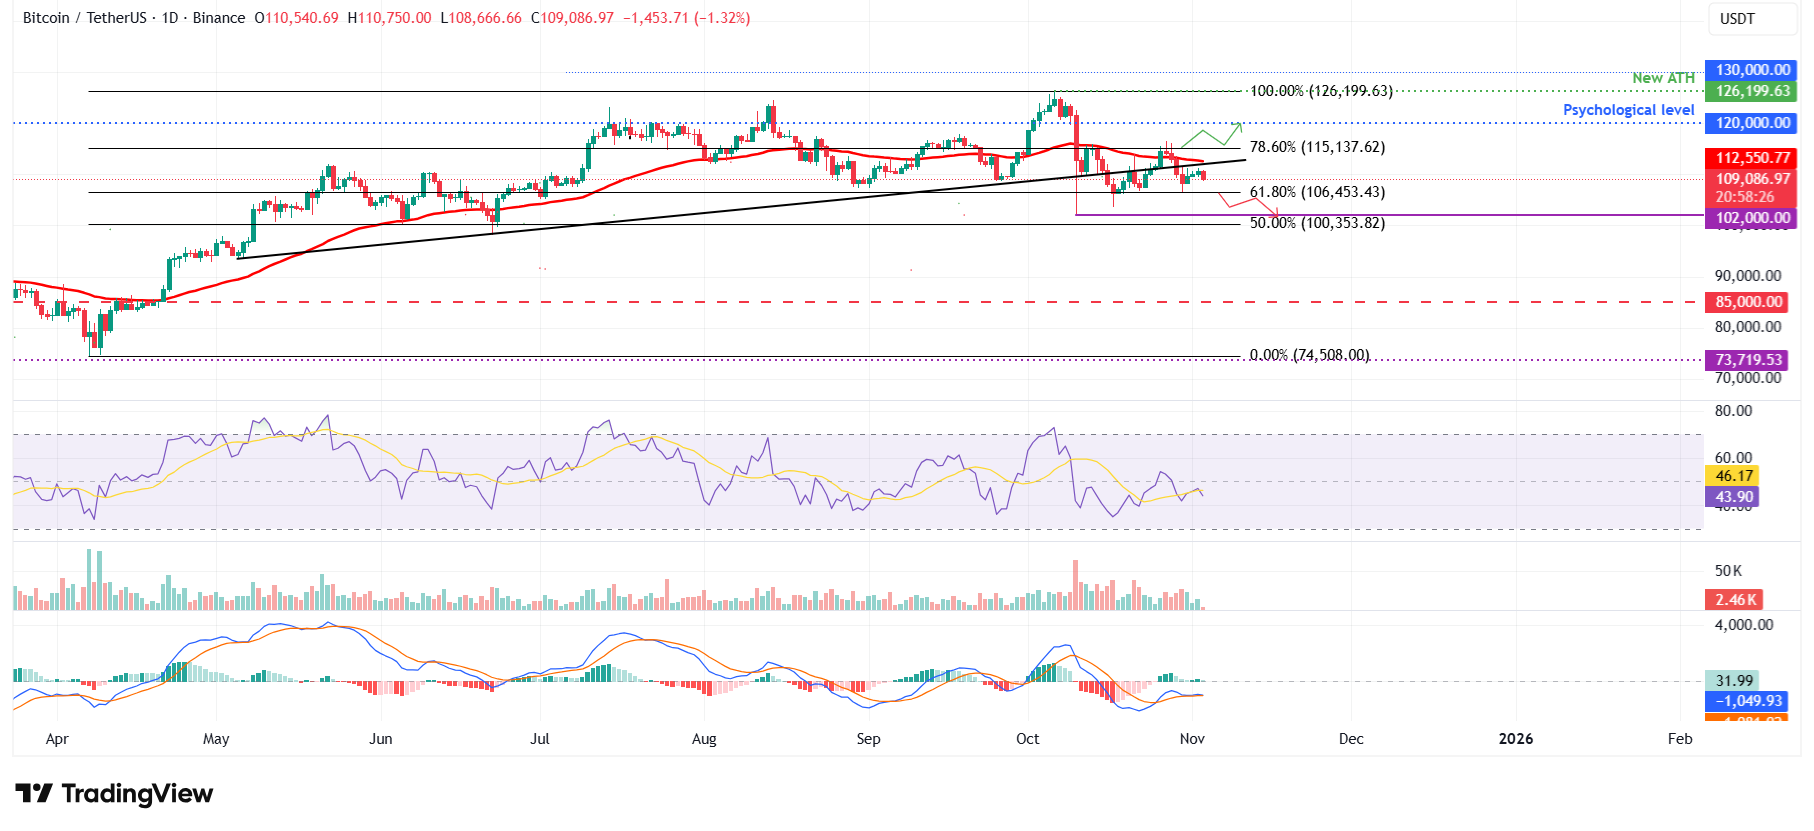
BTC/USDT daily chart
However, if BTC finds support around the 61.8% Fibonacci retracement level at $106,453, it could extend the recovery toward the 50-day EMA at $112,550.
Ethereum faces rejection from the key resistance zone
Ethereum price faced rejection at the daily resistance level of $4,232 last week and declined by 6%. At the time of writing on Monday, ETH trades in red at around $3,759.
If ETH continues its correction, it could extend the decline toward the 61.8% Fibonacci retracement level at $3,593.
Like Bitcoin, Ethereum’s RSI and MACD indicators are signaling a bearish view.
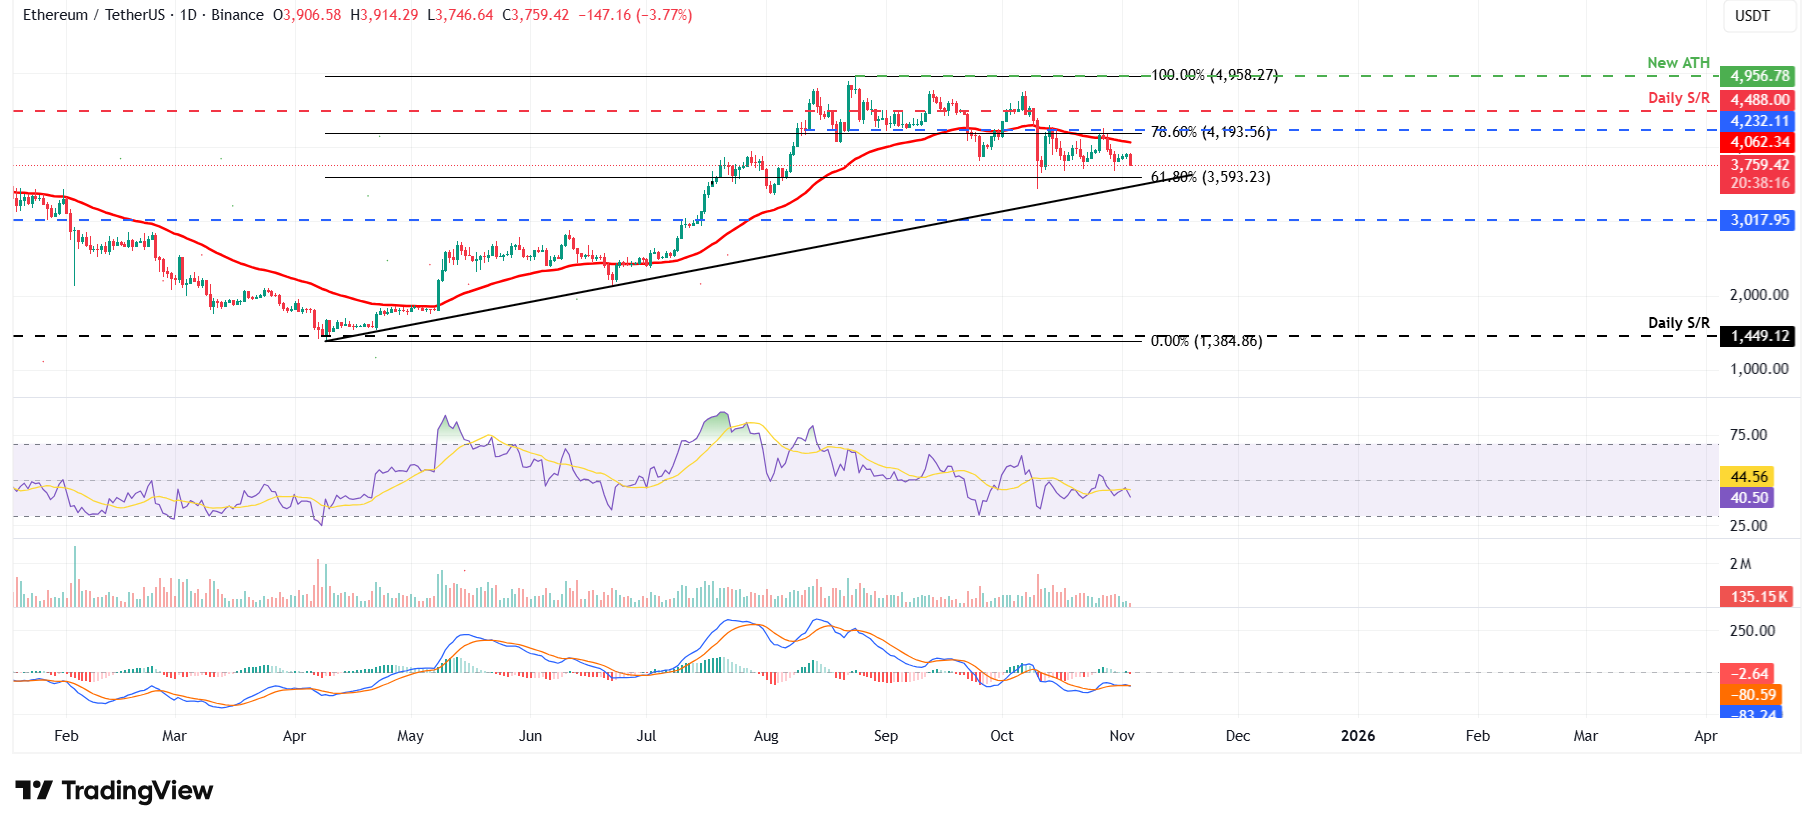
ETH/USDT daily chart
On the other hand, if ETH recovers, it could extend the recovery toward the 50-day EMA at $4,062.
XRP could extend its correction if it closes below $2.35 mark
XRP price faced rejection from the 50-day EMA at $2.64 last week and declined 4.51%. At the time of writing on Monday, XRP trades down at $2.44, nearing the daily support level at $2.35.
If XRP breaks and closes below the daily support at $2.35, it could extend the correction toward the next daily support at $1.96.
Like Bitcoin and Ethereum, XRP RSI and MACD are showing early signs of bearish momentum.
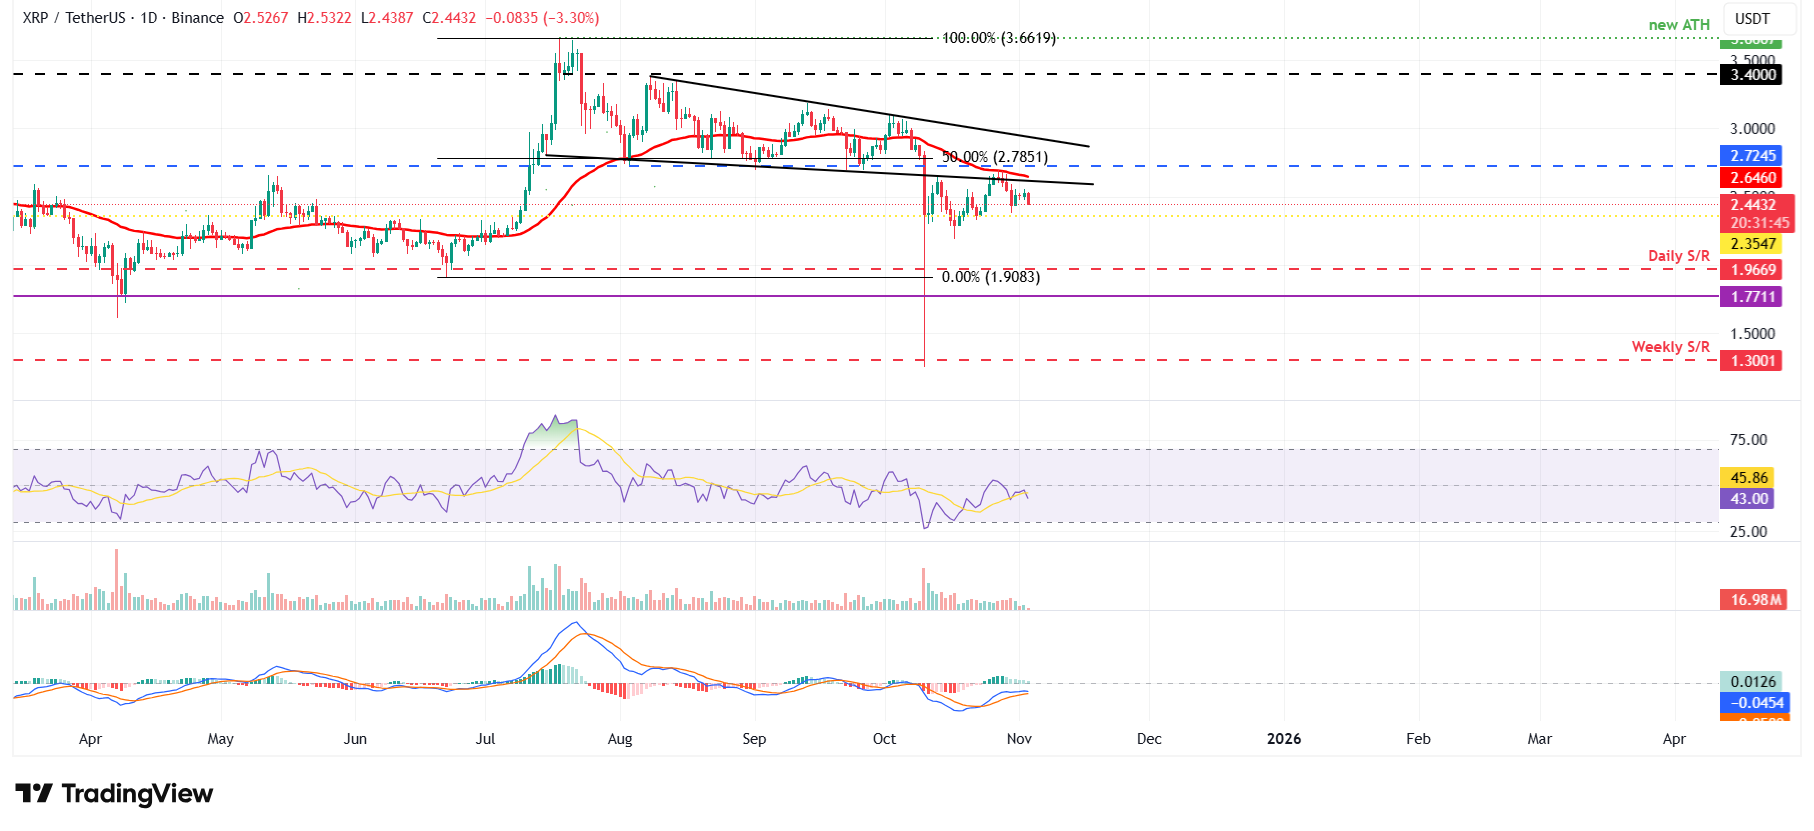
XRP/USDT daily chart
On the other hand, if XRP recovers, it could extend the recovery toward the 50-day EMA at $2.64.
Cryptocurrency metrics FAQs
The developer or creator of each cryptocurrency decides on the total number of tokens that can be minted or issued. Only a certain number of these assets can be minted by mining, staking or other mechanisms. This is defined by the algorithm of the underlying blockchain technology. On the other hand, circulating supply can also be decreased via actions such as burning tokens, or mistakenly sending assets to addresses of other incompatible blockchains.
Market capitalization is the result of multiplying the circulating supply of a certain asset by the asset’s current market value.
Trading volume refers to the total number of tokens for a specific asset that has been transacted or exchanged between buyers and sellers within set trading hours, for example, 24 hours. It is used to gauge market sentiment, this metric combines all volumes on centralized exchanges and decentralized exchanges. Increasing trading volume often denotes the demand for a certain asset as more people are buying and selling the cryptocurrency.
Funding rates are a concept designed to encourage traders to take positions and ensure perpetual contract prices match spot markets. It defines a mechanism by exchanges to ensure that future prices and index prices periodic payments regularly converge. When the funding rate is positive, the price of the perpetual contract is higher than the mark price. This means traders who are bullish and have opened long positions pay traders who are in short positions. On the other hand, a negative funding rate means perpetual prices are below the mark price, and hence traders with short positions pay traders who have opened long positions.

FXStreet
Plus d’un million d’utilisateurs se tournent vers FXStreet pour des données de marché en temps réel, des outils de graphiques, des analyses d’experts et des actualités Forex. Leur calendrier économique complet et leurs webinaires éducatifs aident les traders à rester informés et à prendre des décisions éclairées. FXStreet s’appuie sur une équipe d’environ 60 professionnels répartis entre le siège de Barcelone et diverses régions du monde.
Read More


