
Trade The World
Top 3 Price Prediction: Bitcoin, Ethereum, Ripple – BTC, ETH, and XRP recover as momentum show fading bearish signs
Par Manish Chhetri
Date de publication: 26 Nov 2025 | Date de modification: 26 Nov 2025


POPULAR ARTICLES

Bitcoin (BTC), Ethereum (ETH), and Ripple (XRP) prices hover around key levels mid-week after rebounding from support. The price action of these top three cryptocurrencies suggests fading bearish momentum in the technical indicators, hinting at a possible recovery in the coming days.
- Bitcoin price steadies around $87,500 on Wednesday after a four-week decline.
- Ethereum price hovers around $2,900, finding support around the 61.8% Fibonacci retracement at $2,749.
- XRP price holds above $2, rebounding from the lower boundary of a descending channel in the previous week.
Bitcoin (BTC), Ethereum (ETH), and Ripple (XRP) prices hover around key levels mid-week after rebounding from support. The price action of these top three cryptocurrencies suggests fading bearish momentum in the technical indicators, hinting at a possible recovery in the coming days.
Bitcoin price steadies after massive correction
Bitcoin price found support roughly around the key psychological level of $80,000 on Friday, recovered slightly over the weekend, and closed above $88,300 on Monday. However, on Tuesday, BTC saw a slight correction, closing the day at $87,369. At the time of writing on Wednesday, BTC steadies at around $87,400.
If BTC continues its recovery, it could extend the rally toward the next key resistance at $90,000.
The Relative Strength Index (RSI) on the daily chart reads 31, after slipping below the oversold threshold last week, suggesting that downside pressure may be moderating as bearish momentum shows early signs of exhaustion.
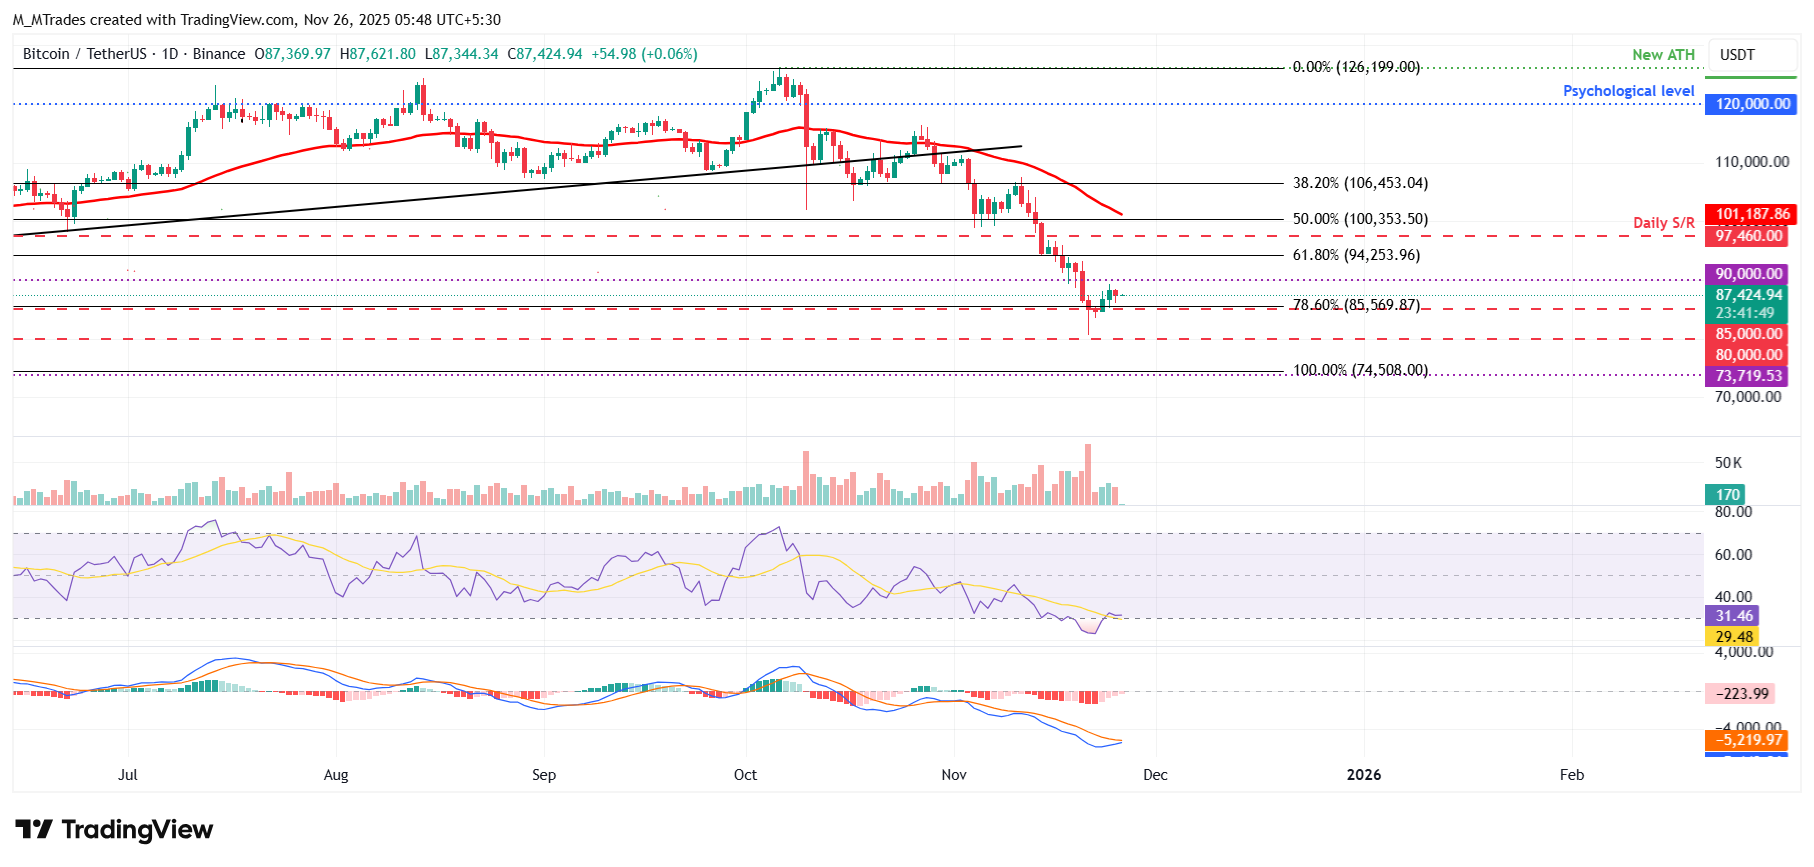
On the other hand, if BTC continues to drop, it could extend the decline toward the key psychological level at $80,000.
Ethereum price shows fading bearishness on momentum indicators
Ethereum price faced rejection at the previously broken trendline on November 13 and declined more than 18% over the following eight days, reaching a low of $2,623 on Friday. ETH recovered nearly 7% in the next three days, after finding support near the 61.8% Fibonacci retracement level at $2,749. At the time of writing on Wednesday, ETH hovers at around $2,900.
If ETH continues its recovery, it could extend the rally toward the daily resistance level at $3,017. A successful close above this could extend additional gains toward the 50-day EMA at $3,483.
Like Bitcoin, Ethereum's RSI is rebounding from oversold territory, suggesting early signs of exhaustion and a potential recovery ahead. The MACD indicator also showed a bullish crossover on Tuesday, providing a buy signal and further supporting the recovery thesis.
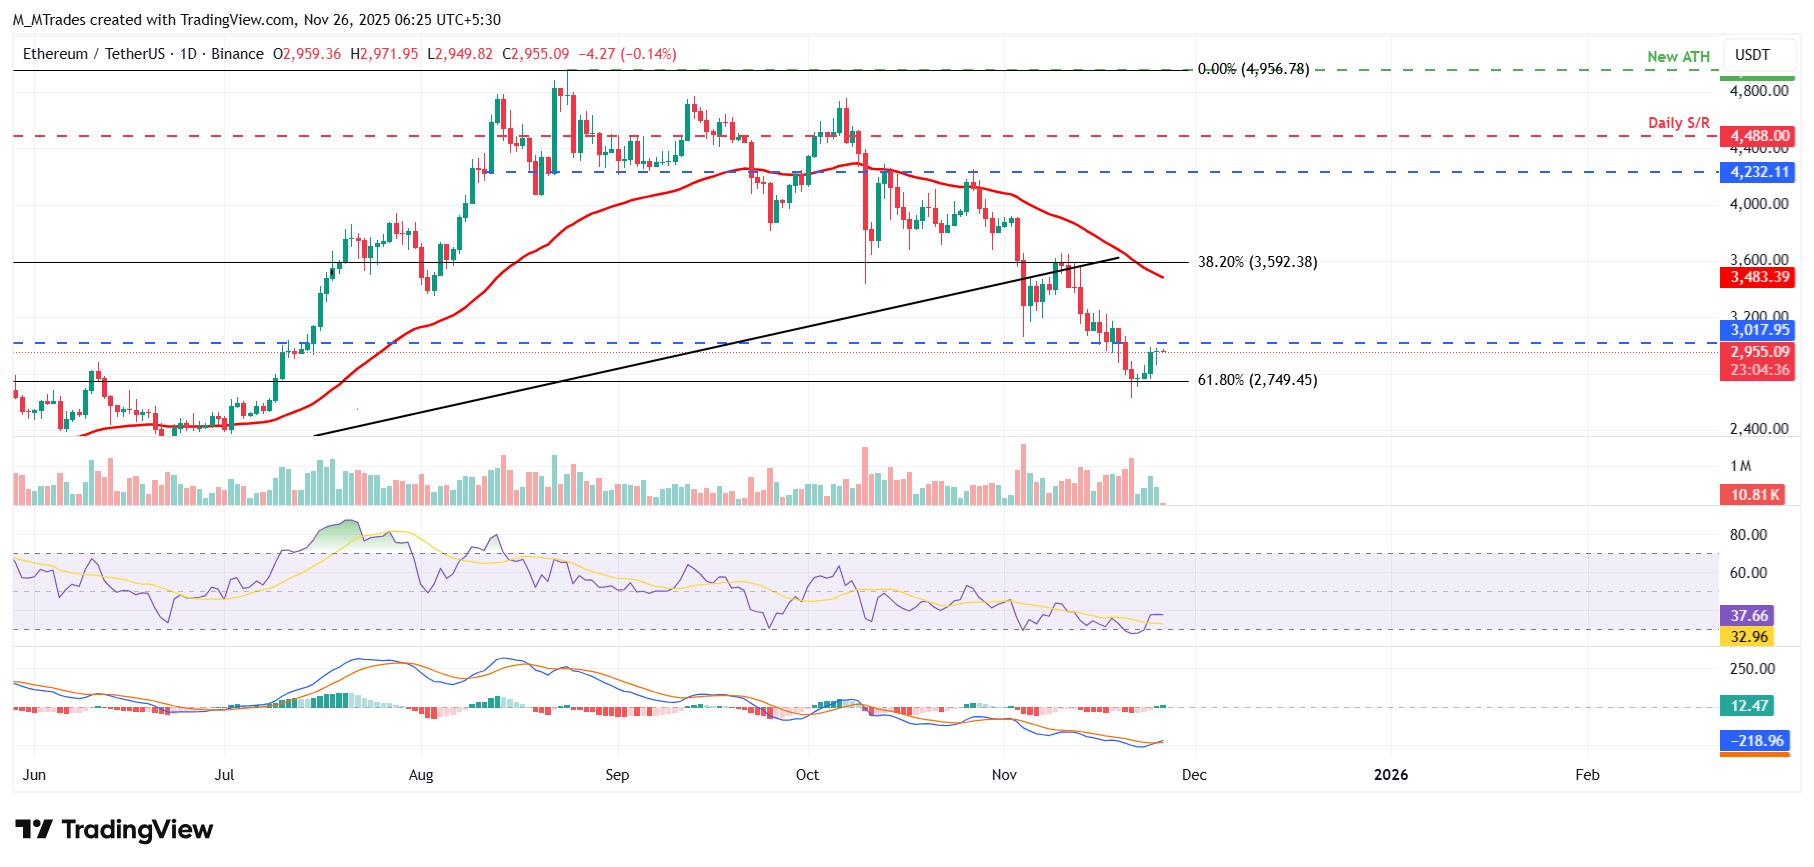
On the other hand, if ETH faces continued decline, it could extend the drop toward the 61.8% Fibonacci retracement level at $2,749.
XRP could extend recovery after finding support around lower channel boundary
XRP price retested and found support around the lower trendline of the descending channel (drawn by connecting multiple highs and lows with two trendlines) on Saturday and recovered 14.19% in the next two days. At the time of writing on Wednesday, XRP hovers at around $2.20.
If XRP continues its recovery, it could extend the rally toward the next daily resistance level at $2.35, which roughly coincides with the 50-day EMA at $2.37.
The RSI reads 47, rebounding from oversold territory last week, suggesting that bearish pressure is easing and supporting a recovery view. Additionally, the MACD showed a bullish crossover on Tuesday, providing a buy signal and further supporting the recovery thesis.
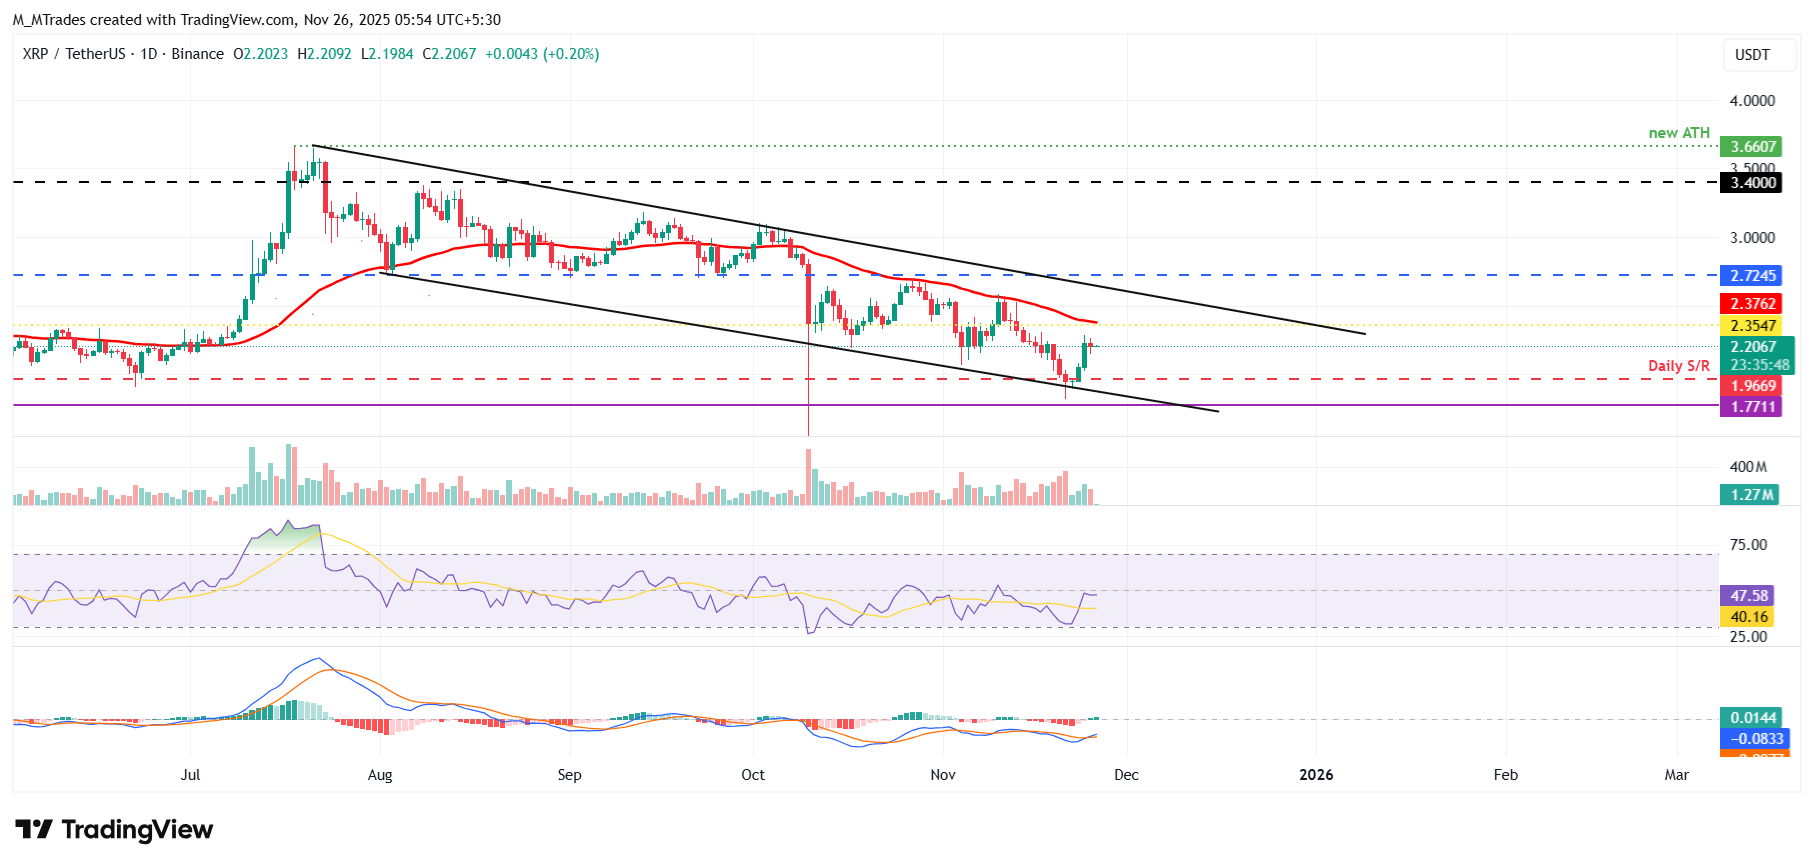
On the other hand, if XRP corrects, it could extend the decline toward the Friday low of $1.82.
Cryptocurrency metrics FAQs
The developer or creator of each cryptocurrency decides on the total number of tokens that can be minted or issued. Only a certain number of these assets can be minted by mining, staking or other mechanisms. This is defined by the algorithm of the underlying blockchain technology. On the other hand, circulating supply can also be decreased via actions such as burning tokens, or mistakenly sending assets to addresses of other incompatible blockchains.
Market capitalization is the result of multiplying the circulating supply of a certain asset by the asset’s current market value.
Trading volume refers to the total number of tokens for a specific asset that has been transacted or exchanged between buyers and sellers within set trading hours, for example, 24 hours. It is used to gauge market sentiment, this metric combines all volumes on centralized exchanges and decentralized exchanges. Increasing trading volume often denotes the demand for a certain asset as more people are buying and selling the cryptocurrency.
Funding rates are a concept designed to encourage traders to take positions and ensure perpetual contract prices match spot markets. It defines a mechanism by exchanges to ensure that future prices and index prices periodic payments regularly converge. When the funding rate is positive, the price of the perpetual contract is higher than the mark price. This means traders who are bullish and have opened long positions pay traders who are in short positions. On the other hand, a negative funding rate means perpetual prices are below the mark price, and hence traders with short positions pay traders who have opened long positions.

FXStreet
Plus d’un million d’utilisateurs se tournent vers FXStreet pour des données de marché en temps réel, des outils de graphiques, des analyses d’experts et des actualités Forex. Leur calendrier économique complet et leurs webinaires éducatifs aident les traders à rester informés et à prendre des décisions éclairées. FXStreet s’appuie sur une équipe d’environ 60 professionnels répartis entre le siège de Barcelone et diverses régions du monde.
Read More


