
Trade The World
Top 3 Price Prediction: Bitcoin, Ethereum, Ripple – BTC struggles near $108,000, ETH and XRP extend correction
Par Manish Chhetri
Date de publication: 17 Oct 2025 | Date de modification: 17 Oct 2025


POPULAR ARTICLES

Bitcoin (BTC), Ethereum (ETH), and Ripple (XRP) remain under pressure at the time of writing on Friday after extending the losses nearly 5%, 6%, and 7%, respectively.
- Bitcoin price hovers around $108,800 on Friday after falling more than 5% so far this week.
- Ethereum continues its correction after retesting daily resistance at $4,232 earlier in the week.
- XRP closes below the daily support at $2.35, signaling potential for further downside ahead.
Bitcoin (BTC), Ethereum (ETH), and Ripple (XRP) remain under pressure at the time of writing on Friday after extending the losses nearly 5%, 6%, and 7%, respectively. BTC struggles near $108,000 while ETH and XRP close below their key supports, suggesting the potential for further downside in the near term.
Bitcoin closes below the ascending trendline
Bitcoin price faced rejection from the 50-day Exponential Moving Average (EMA) at $114,822 on Tuesday and declined by nearly 6% until Thursday, closing below the ascending trendline. At the time of writing on Friday, BTC hovers at around $109,000.
If BTC continues its correction and closes below the 200-day EMA at $108,070, it could extend the decline toward the October 10 low of $102,000.
The Relative Strength Index (RSI) indicator at 39 on the daily chart suggests that bearish momentum is gaining traction. Additionally, the Moving Average Convergence Divergence (MACD) showed a bearish crossover last week, which remains in effect, further supporting the bearish view.
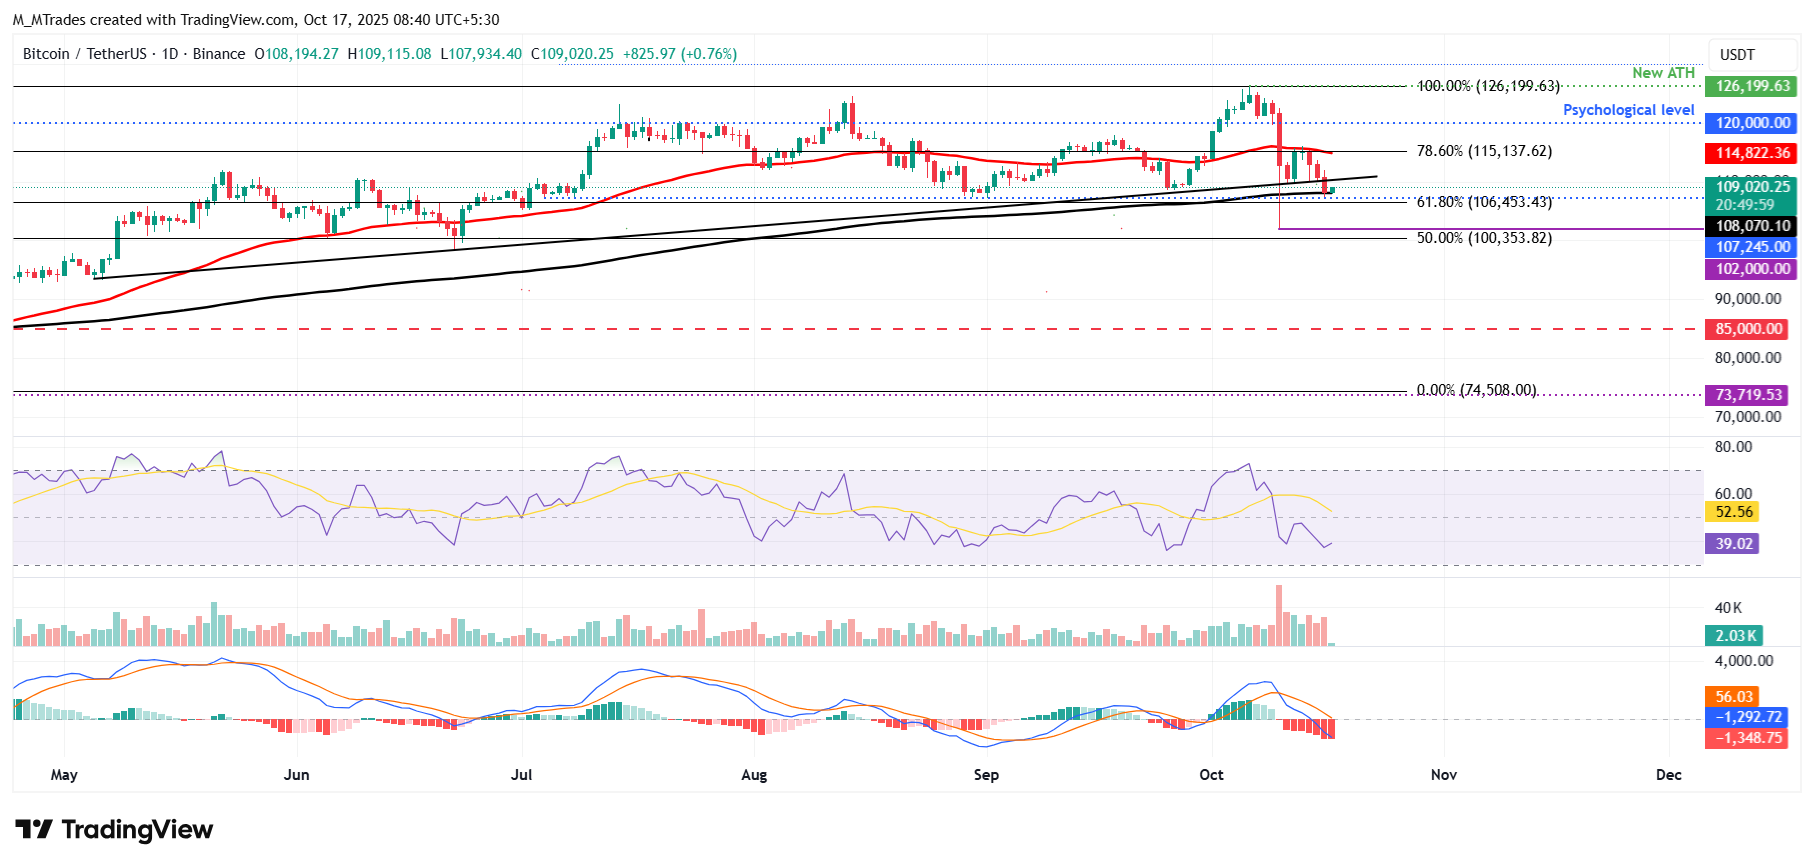
BTC/USDT daily chart
On the other side, if BTC recovers, it could extend the recovery toward the 50-day EMA at $114,822.
Ethereum bears are in control of the momentum
Ethereum price faced rejection from the daily resistance level at $4,232, which roughly coincides with the 50-day EMA and the 78.6% Fibonacci retracement level on Tuesday and declined 8.88% by Thursday. At the time of writing on Friday, ETH hovers around $3,900.
If ETH continues its pullback, it could extend the decline toward the 61.8% Fibonacci retracement level at $3,953.
Like Bitcoin, Ethereum’s RSI and MACD indicators also support the bearish view.
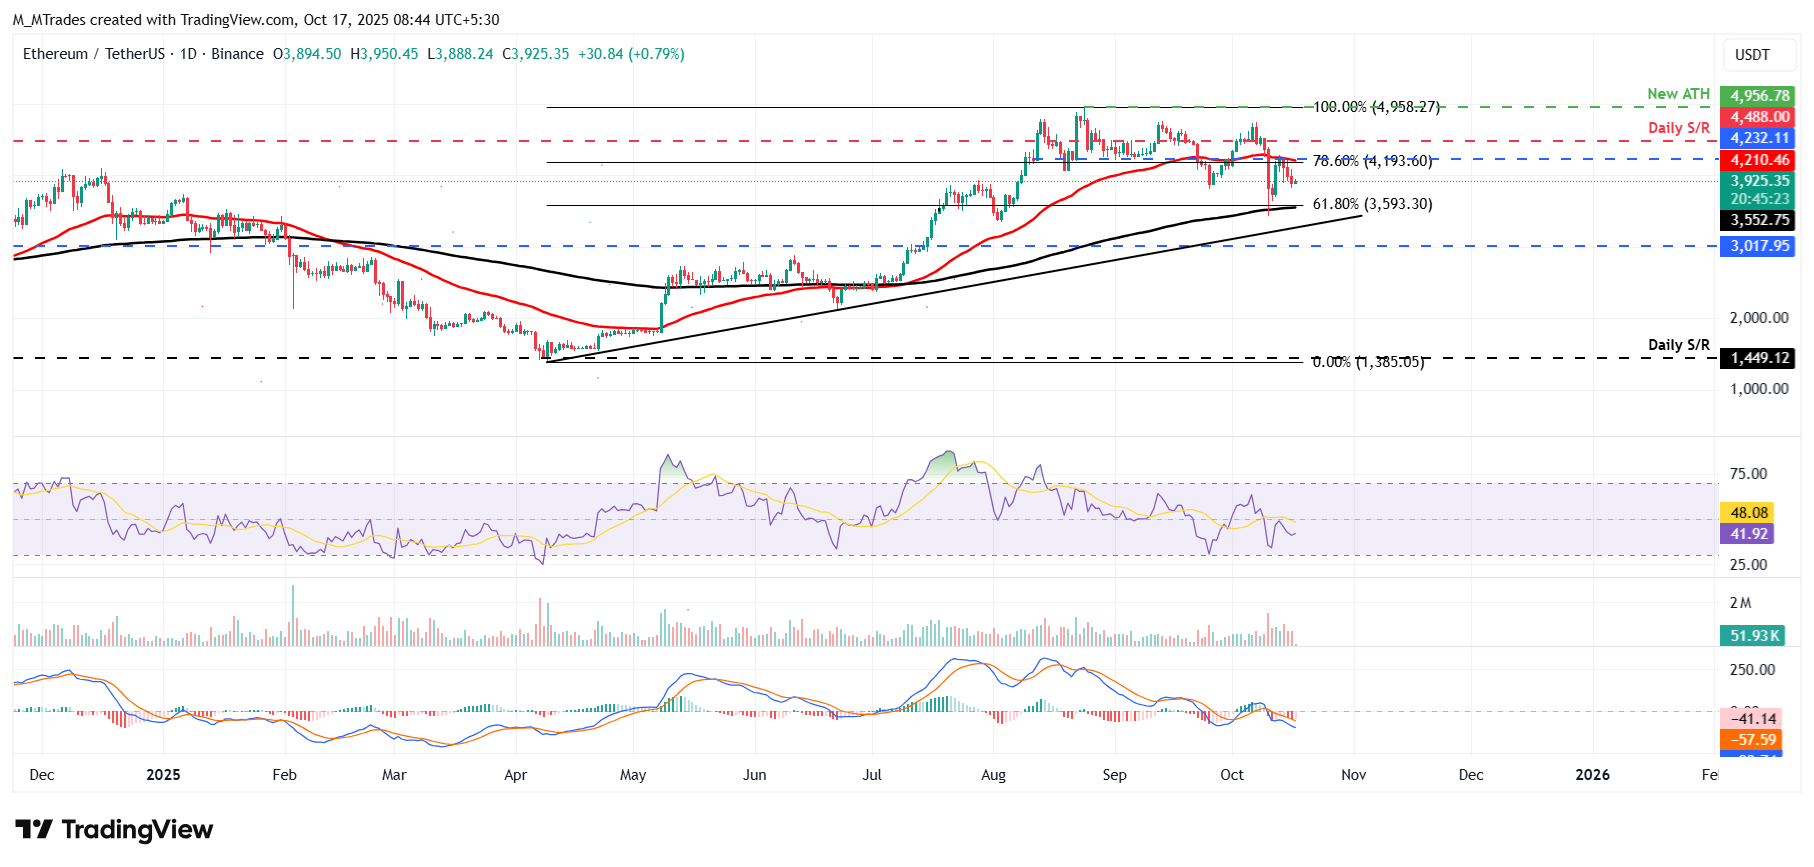
ETH/USDT daily chart
However, if ETH recovers, it could extend the recovery toward the daily resistance level at $4,232.
XRP shows weakness in momentum
Ripple price found resistance around the lower trendline of a falling wedge pattern on Tuesday and declined nearly 11% by Thursday, closing below the daily support at $2.35. At the time of writing on Friday, XRP hovers around $2.35.
If XRP continues its correction, it could extend the decline toward the next daily support at $1.96.
Like Bitcoin and Ethereum, XRP’s momentum indicators, RSI and MACD, also support the bearish view.
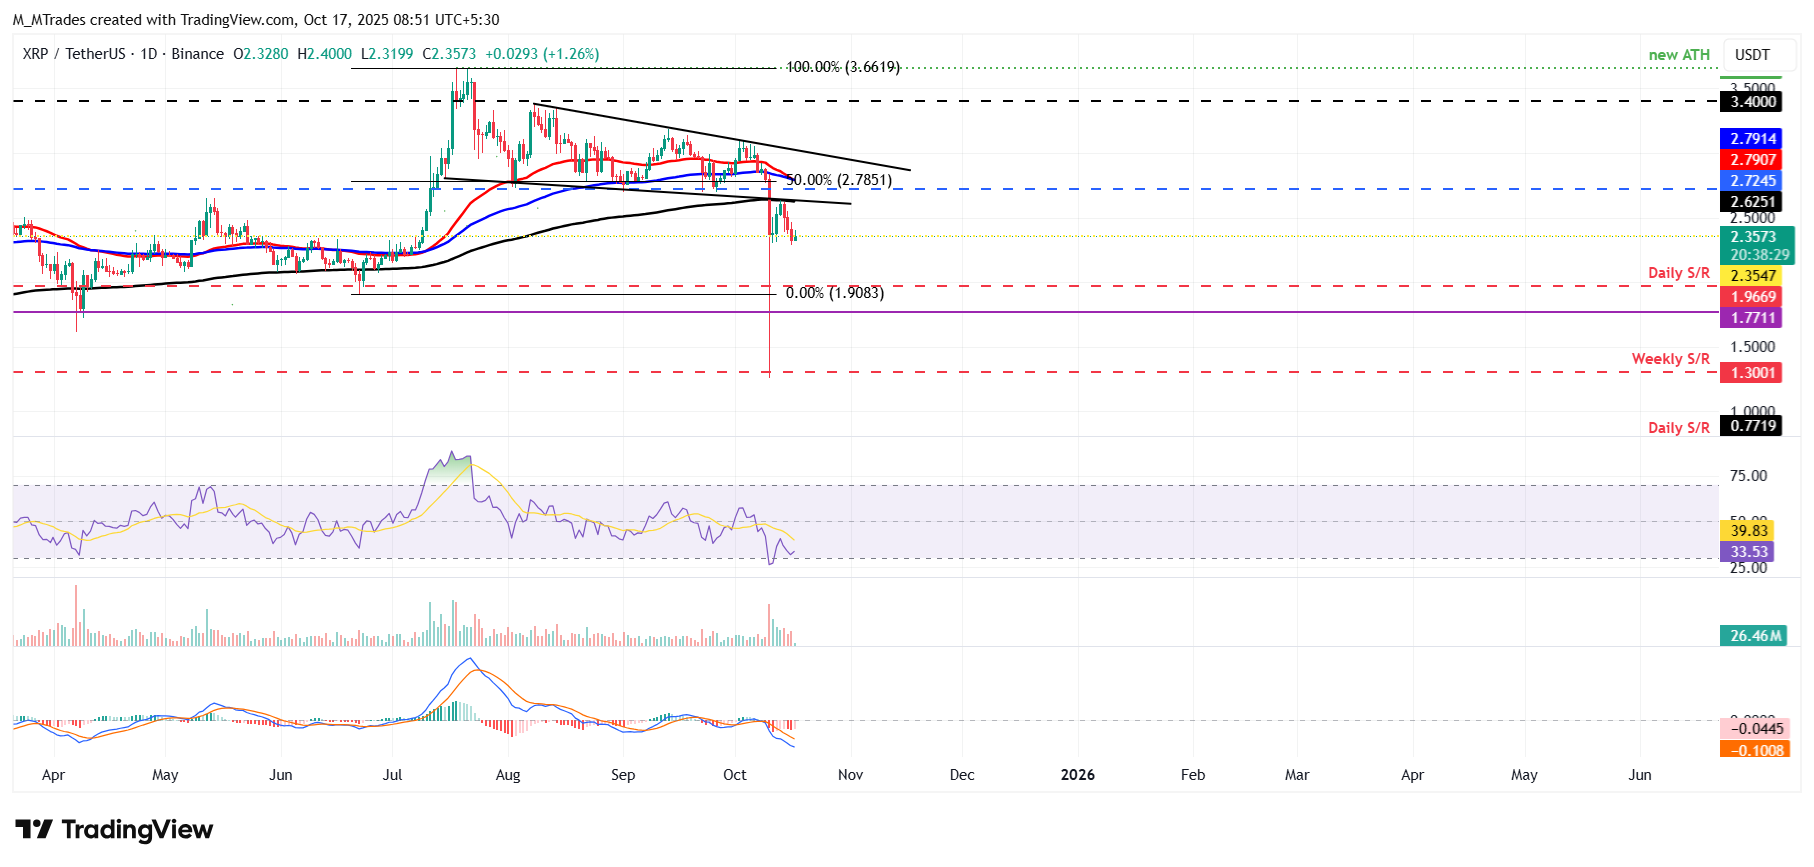
XRP/USDT daily chart
On the other hand, if XRP recovers, it could extend the recovery toward the 200-day EMA at $2.62.
Cryptocurrency metrics FAQs
The developer or creator of each cryptocurrency decides on the total number of tokens that can be minted or issued. Only a certain number of these assets can be minted by mining, staking or other mechanisms. This is defined by the algorithm of the underlying blockchain technology. On the other hand, circulating supply can also be decreased via actions such as burning tokens, or mistakenly sending assets to addresses of other incompatible blockchains.
Market capitalization is the result of multiplying the circulating supply of a certain asset by the asset’s current market value.
Trading volume refers to the total number of tokens for a specific asset that has been transacted or exchanged between buyers and sellers within set trading hours, for example, 24 hours. It is used to gauge market sentiment, this metric combines all volumes on centralized exchanges and decentralized exchanges. Increasing trading volume often denotes the demand for a certain asset as more people are buying and selling the cryptocurrency.
Funding rates are a concept designed to encourage traders to take positions and ensure perpetual contract prices match spot markets. It defines a mechanism by exchanges to ensure that future prices and index prices periodic payments regularly converge. When the funding rate is positive, the price of the perpetual contract is higher than the mark price. This means traders who are bullish and have opened long positions pay traders who are in short positions. On the other hand, a negative funding rate means perpetual prices are below the mark price, and hence traders with short positions pay traders who have opened long positions.

FXStreet
Plus d’un million d’utilisateurs se tournent vers FXStreet pour des données de marché en temps réel, des outils de graphiques, des analyses d’experts et des actualités Forex. Leur calendrier économique complet et leurs webinaires éducatifs aident les traders à rester informés et à prendre des décisions éclairées. FXStreet s’appuie sur une équipe d’environ 60 professionnels répartis entre le siège de Barcelone et diverses régions du monde.
Read More


