
Top Crypto Losers: Monero, Hyperliquid, Morpho test key supports after steep declines
Par Vishal Dixit
Date de publication: 21 Jan 2026 | Date de modification: 21 Jan 2026


ARTICLES POPULAIRES

Monero (XMR), Hyperliquid (HYPE), and Morpho (MORPHO) are leading the decline on Wednesday as the cryptocurrency market suffers over $1 billion in liquidations over the last 24 hours.
- Monero nears the $500 psychological support on Wednesday following Tuesday's 20% decline.
- Hyperliquid tests a crucial support after a three-day decline of roughly 18%.
- Morpho approaches the $1 level as Tuesday's 11% drop fuels the downside bias.
Monero (XMR), Hyperliquid (HYPE), and Morpho (MORPHO) are leading the decline on Wednesday as the cryptocurrency market suffers over $1 billion in liquidations over the last 24 hours. Technically, XMR, HYPE, and MORPHO approach crucial support levels on Wednesday after recording sharp losses on Tuesday.
The pullback aligns with the gap-down move in the US stock market on Tuesday amid new tariff threats, pending court orders, geopolitical tensions, and Japan’s bond market blowout.
Monero risks a drop below $500
Monero trades close to $500 at press time on Wednesday, as this psychological support level caps the downside move after a 20% plunge the previous day. The privacy coin could find deeper support at the 50-day Exponential Moving Average (EMA) at $484 and the 100-day EMA at $432, keeping the broader bullish bias intact.
The Moving Average Convergence Divergence (MACD) indicator on the daily chart shows negative histograms expanding as the MACD line crosses below the red line and both lines are below zero, suggesting bearish pressure.
The Relative Strength Index (RSI) is at 47.55 on the same chart, confirming momentum has cooled.
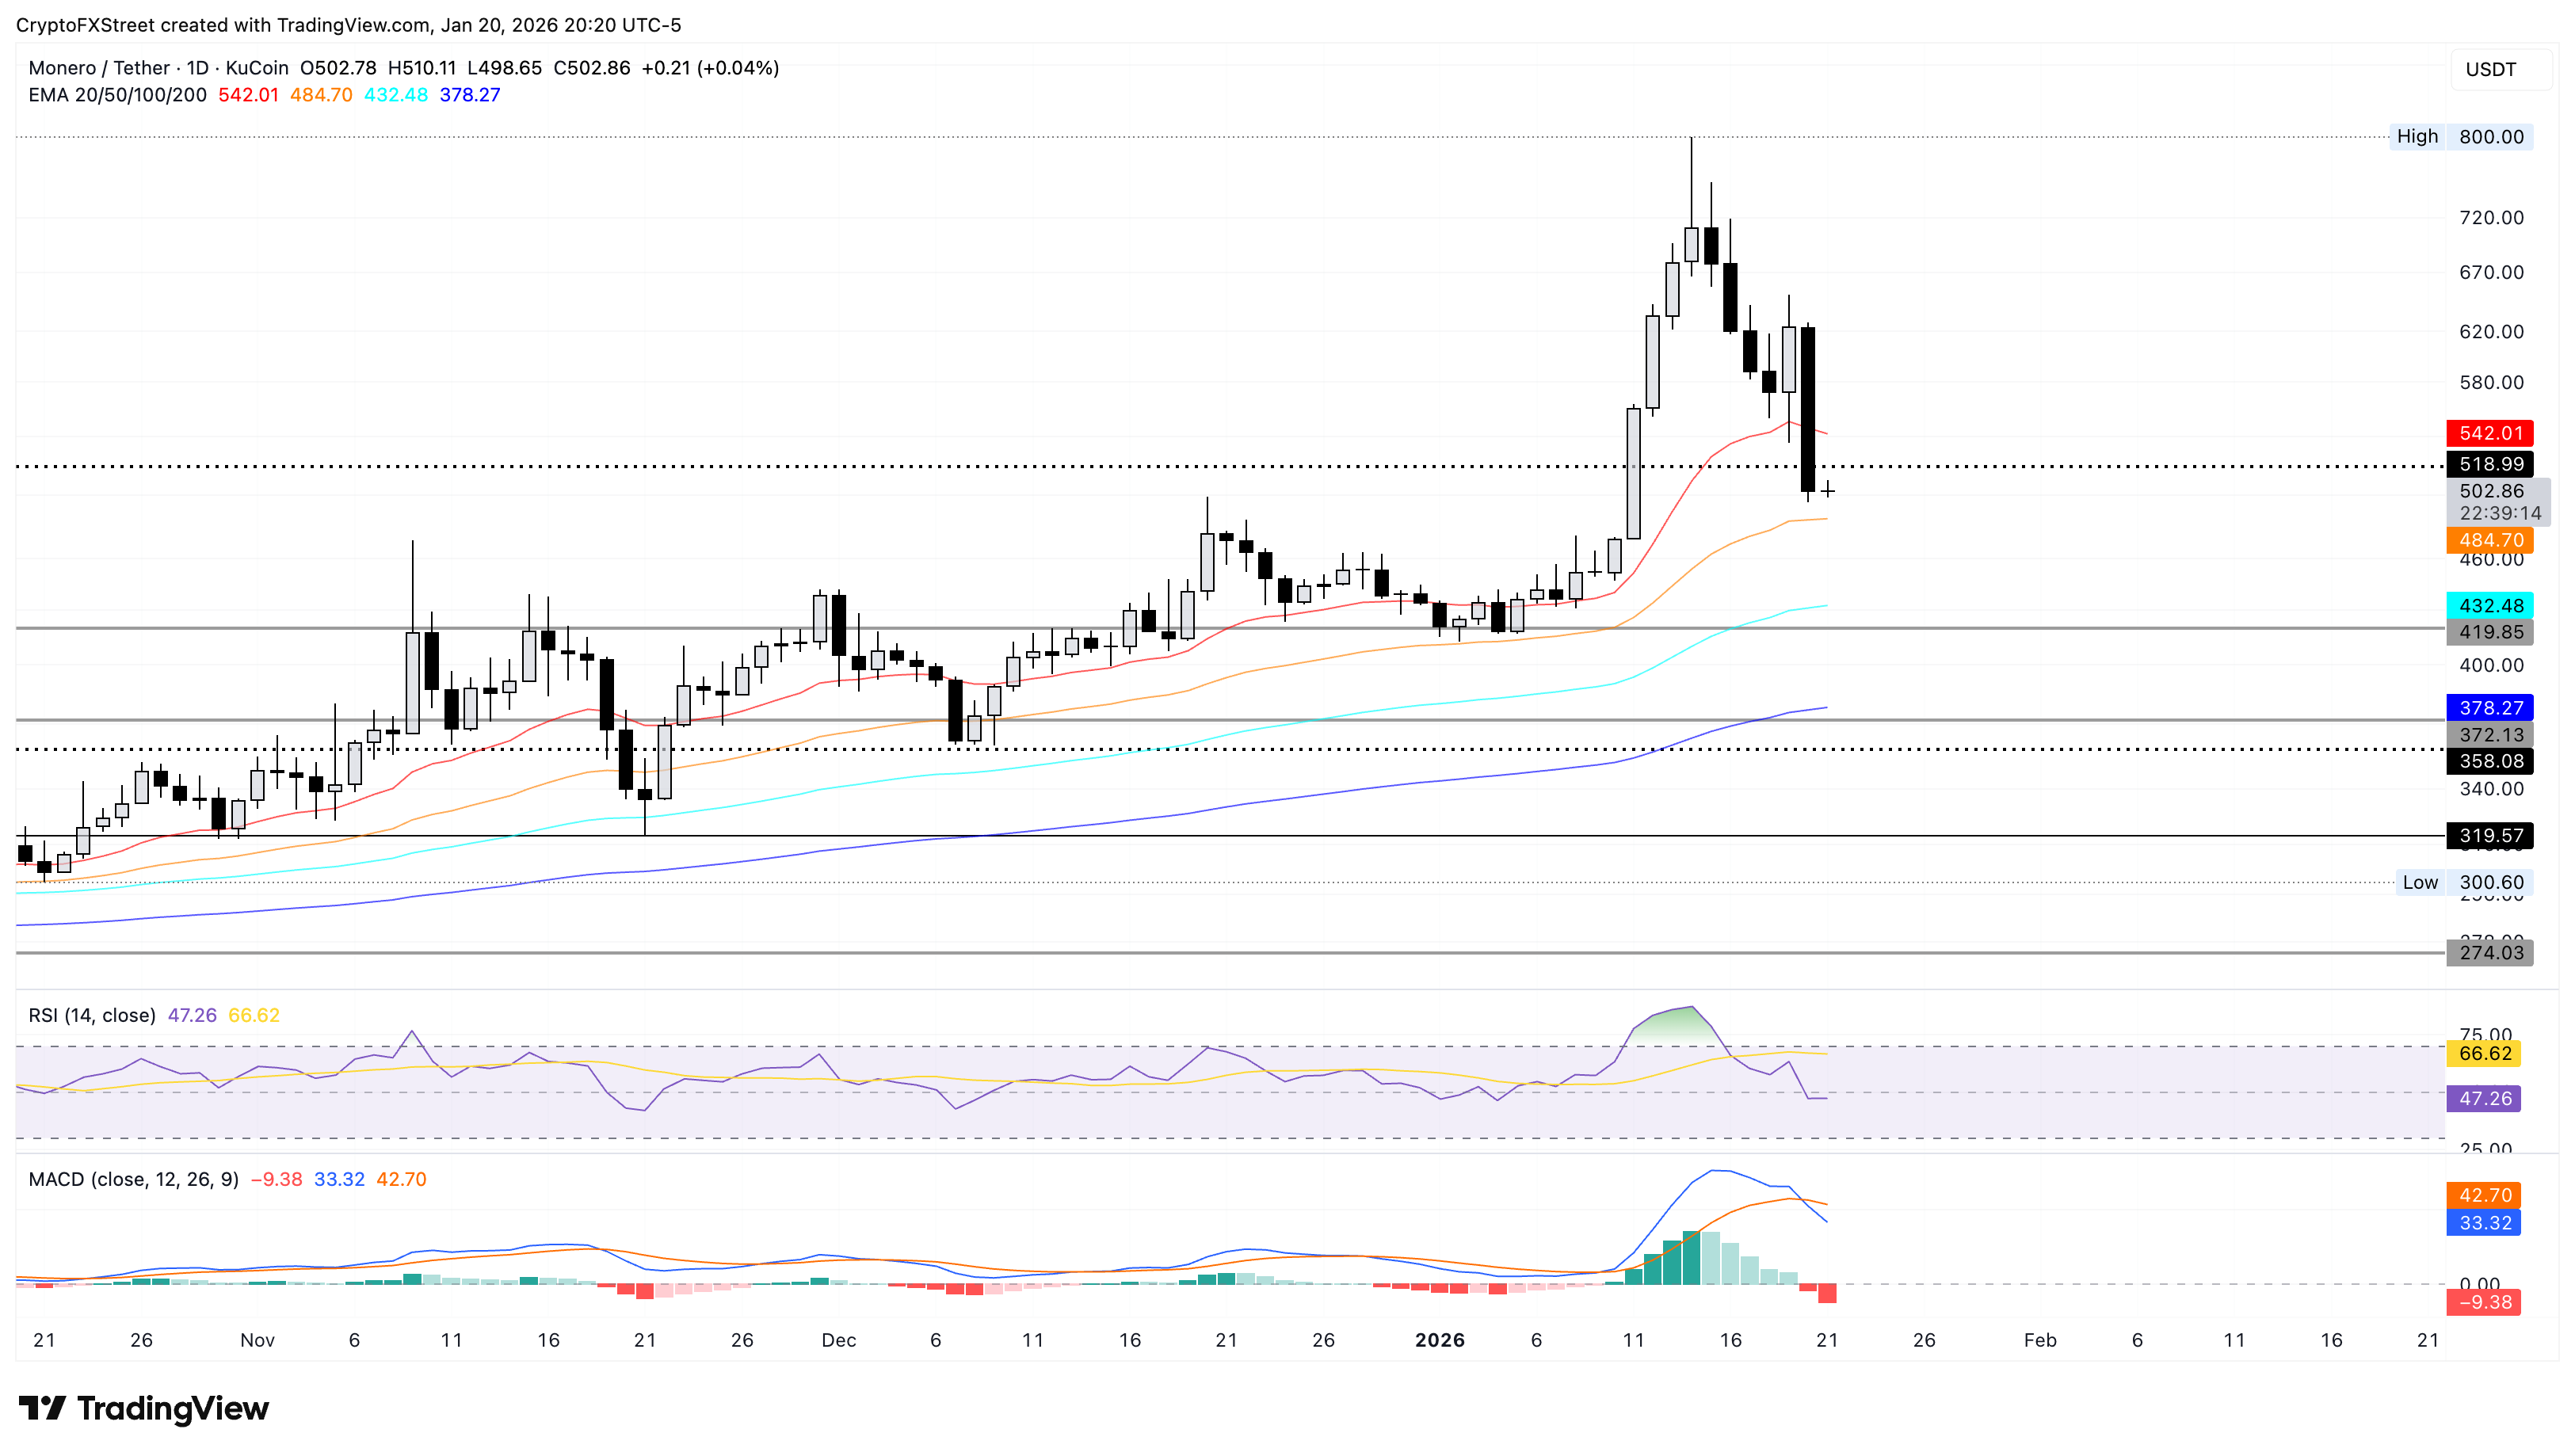
On the upside, a sustained close above the 20-day EMA at $542 could extend the XMR rebound, targeting the $600 round figure.
Hyperliquid buds from a crucial support level
Hyperliquid trades above $21 at the time of writing on Wednesday after an 11% drop on Tuesday. The exchange token is up 2% on the day, reflecting a short-term relief after a three-day decline of roughly 18%.
The MACD indicator sustains a sell signal from the bearish crossover on Monday, as both average lines reverse further into negative territory while the red histograms expand. At the same time, the RSI at 35 hovers near the oversold zone, reflecting the downside bias.
If HYPE sustains a daily close below the October 10 low at $20.82, it could test the S1 Pivot Point at $19.70, opening the door to further downside risk.
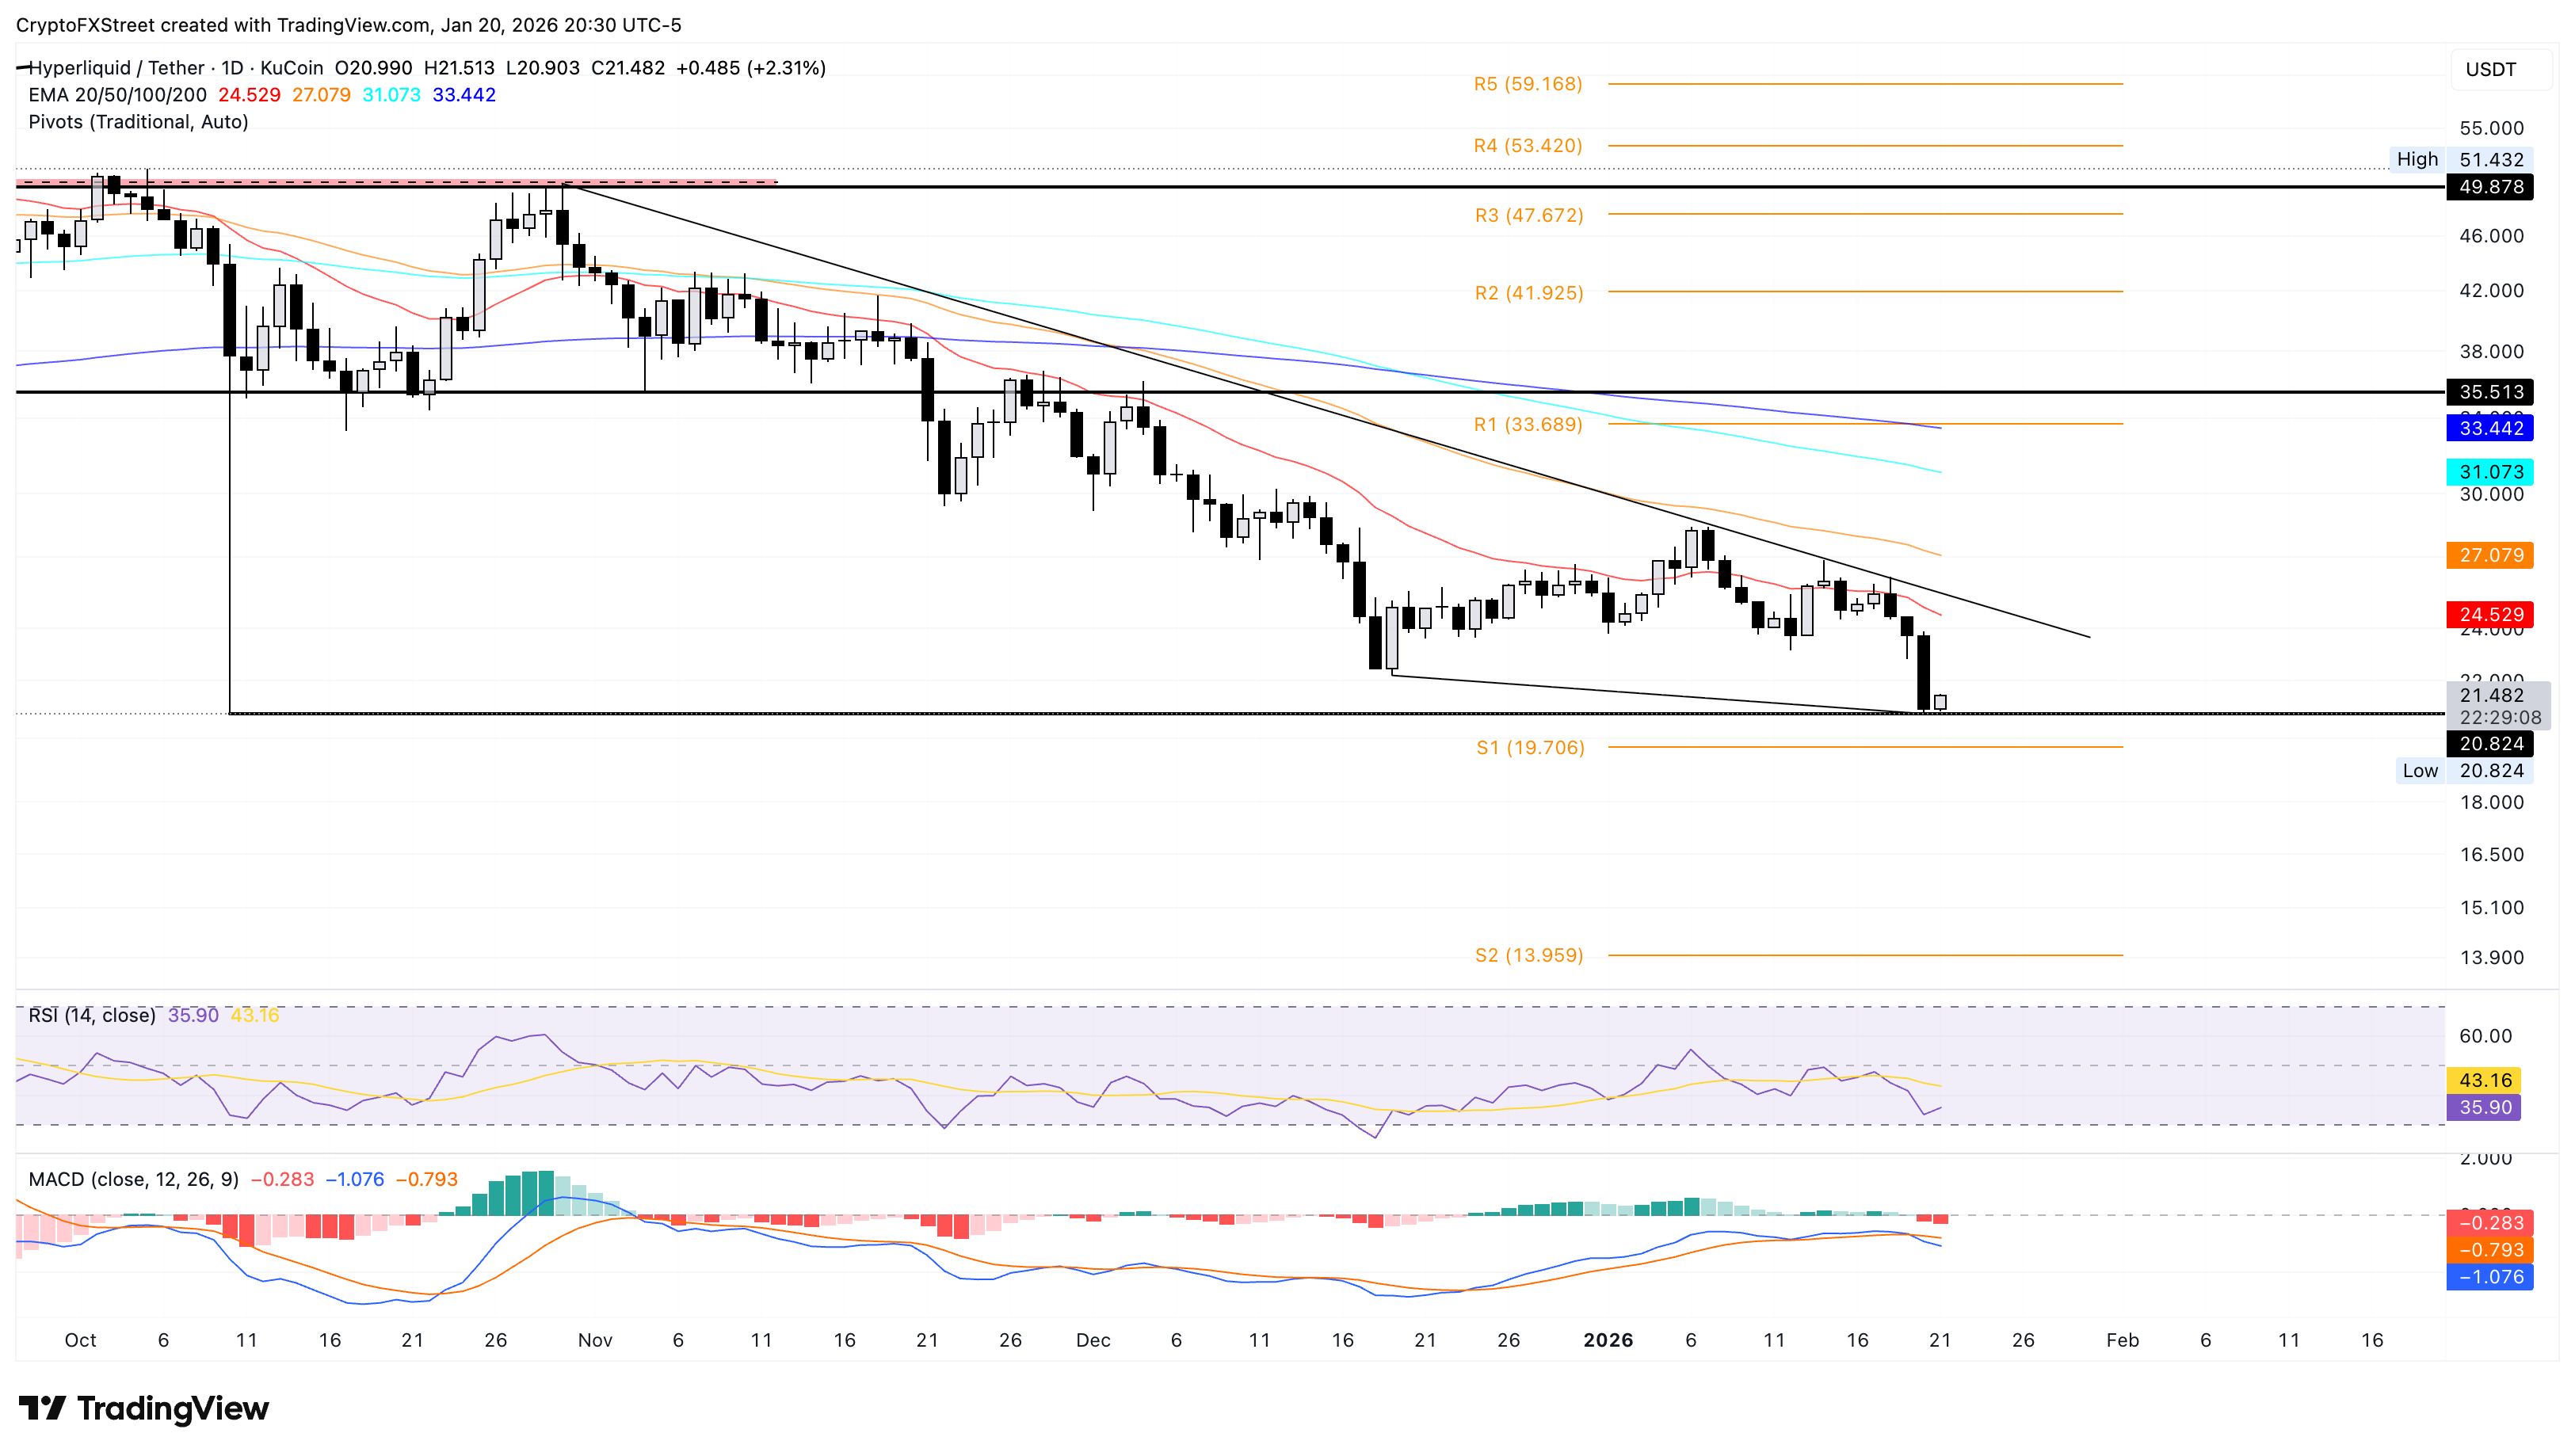
However, a sustained rebound from $20 could run into the 20-day EMA at $24.52 as immediate resistance.
Morpho’s short-term recovery after a bearish slide
Morpho ticks higher by 2% at press time on Wednesday, after a roughly 20% decline over the past six days. MORPHO trades below the 20-, 50-, and 200-day EMAs, which are sloping downward, reaffirming the bearish bias.
The immediate support for MORPHO lies at the December 28 low at $1.08. If it clears this level, the downside move could extend below the $1 mark, targeting the S1 Pivot Point at $0.94.
Similar to Hyperliquid, the MACD shows a bearish crossover, with the blue line approaching zero as the negative histogram widens, signaling intense bearish momentum.
Additionally, the RSI at 40 shows a sharp dive below the midline, indicating a sudden sell-side shift with further room on the downside before reaching oversold conditions.
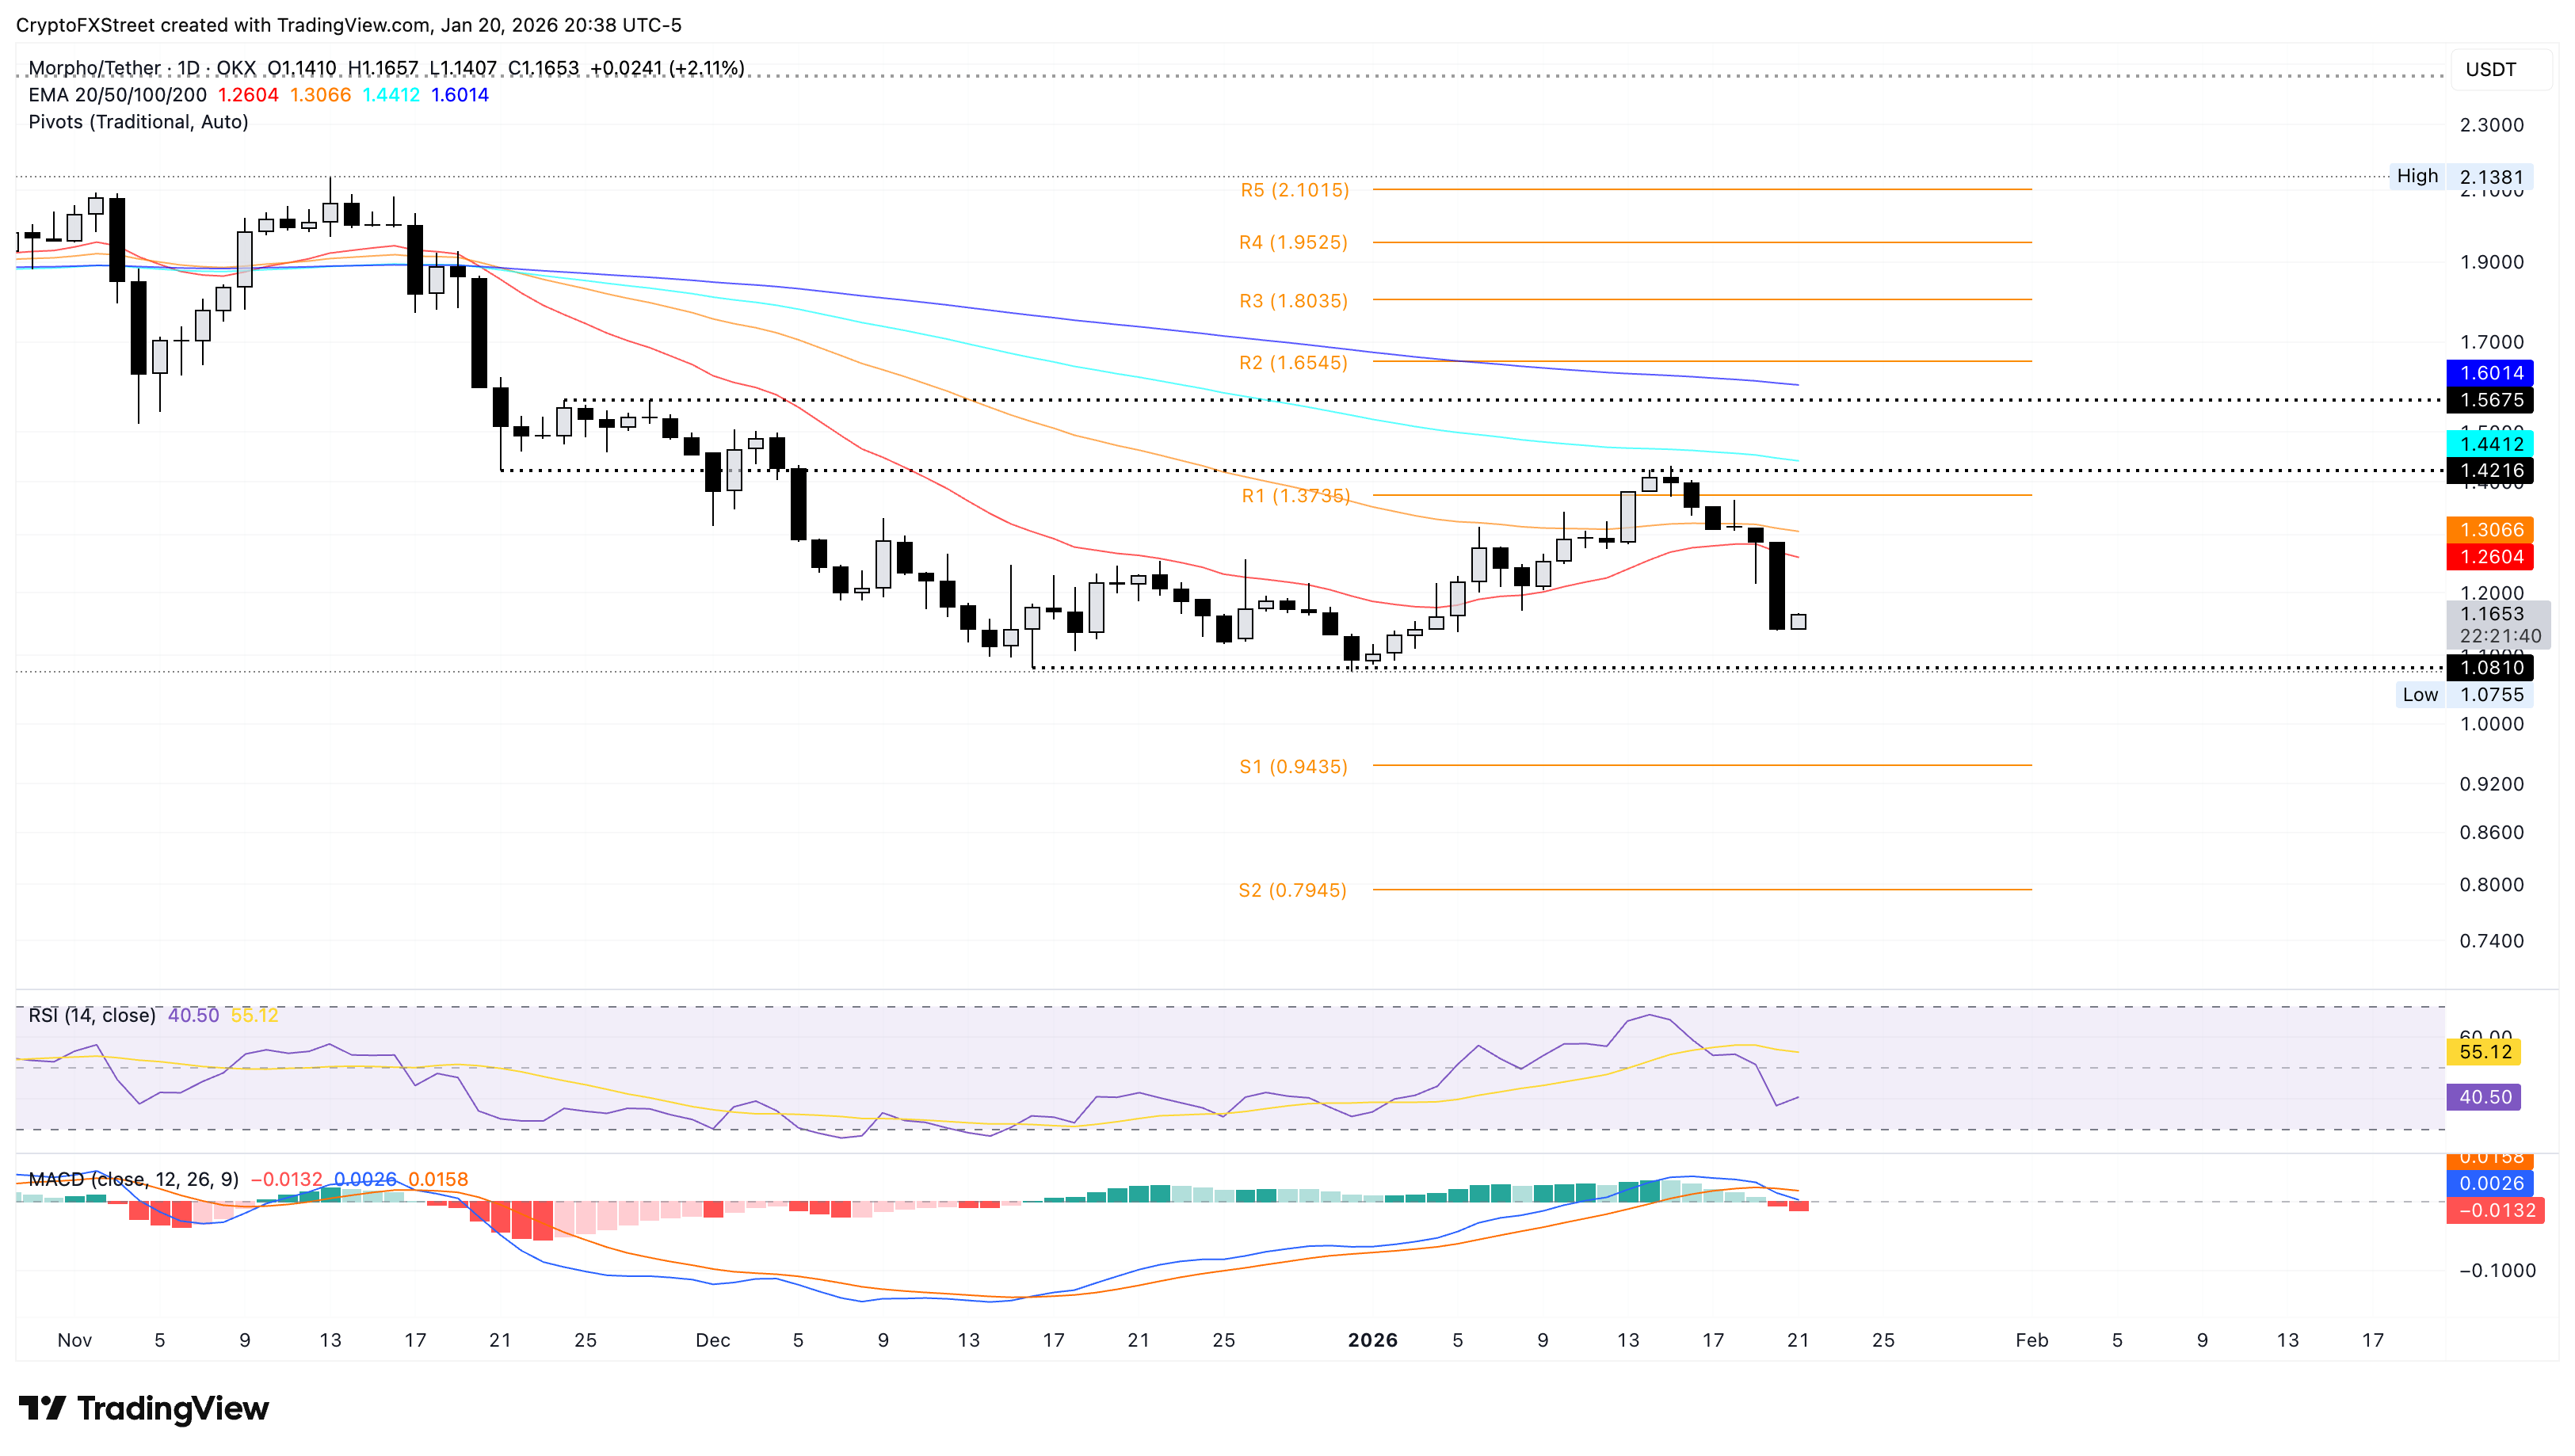
An extended recovery in MORPHO could face opposition at the 20-day EMA at $1.26, attempting to cap gains.
(The technical analysis of Monero was written with the help of an AI tool.)

Plus d’un million d’utilisateurs se tournent vers FXStreet pour des données de marché en temps réel, des outils de graphiques, des analyses d’experts et des actualités Forex. Leur calendrier économique complet et leurs webinaires éducatifs aident les traders à rester informés et à prendre des décisions éclairées. FXStreet s’appuie sur une équipe d’environ 60 professionnels répartis entre le siège de Barcelone et diverses régions du monde.
Lire la suite


