
Trade The World
US Dollar Index Price Forecast: Tests 50-day EMA support after breaking below 99.00
Par Akhtar Faruqui
Date de publication: 12 Jan 2026 | Date de modification: 12 Jan 2026


POPULAR ARTICLES

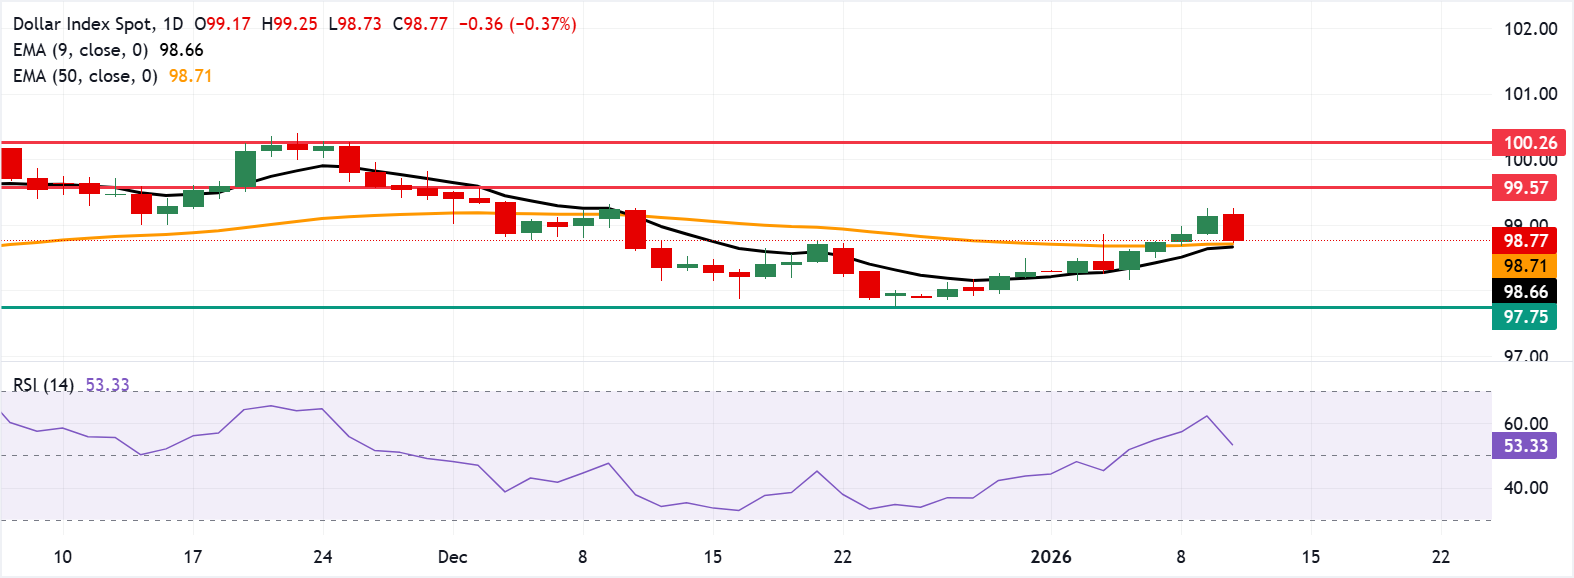
The US Dollar Index (DXY), which measures the value of the US Dollar (USD) against six major currencies, is losing ground after four days of gains and trading around 98.80 during the European hours on Monday.
- US Dollar Index may rebound toward the seven-month high of 99.57
- The 14-day Relative Strength Index at 53 signals improving momentum.
- The immediate support appears at the 50-day EMA of 98.70.
The US Dollar Index (DXY), which measures the value of the US Dollar (USD) against six major currencies, is losing ground after four days of gains and trading around 98.80 during the European hours on Monday. The momentum indicator shows the 14-day Relative Strength Index (RSI) at 53 (neutral) reflects improving momentum.
The US Dollar Index stands marginally above the nine-day Exponential Moving Average (EMA) and the 50-day EMA. The short-term average has turned higher while the 50-day EMA has flattened after a prior decline.
Holding above the rising nine-day EMA would keep the near-term bias supportive and lead the DXY to target the seven-month high of 99.57, recorded on December 2. Further resistance lies at the seven-month high of 100.26, which was recorded on August 1.
On the downside, the immediate support lies at the 50-day EMA of 98.70, aligned with the nine-day EMA at 98.66. Further declines would weaken the short- and medium-term price momentum and put downward pressure on the US Dollar Index to navigate the region around the 97.75, the lowest since October 25.
US Dollar Price Today
The table below shows the percentage change of US Dollar (USD) against listed major currencies today. US Dollar was the weakest against the Swiss Franc.
| USD | EUR | GBP | JPY | CAD | AUD | NZD | CHF | |
|---|---|---|---|---|---|---|---|---|
| USD | -0.48% | -0.39% | -0.05% | -0.27% | -0.23% | -0.39% | -0.61% | |
| EUR | 0.48% | 0.09% | 0.39% | 0.20% | 0.25% | 0.09% | -0.13% | |
| GBP | 0.39% | -0.09% | 0.30% | 0.12% | 0.16% | -0.00% | -0.23% | |
| JPY | 0.05% | -0.39% | -0.30% | -0.19% | -0.15% | -0.31% | -0.53% | |
| CAD | 0.27% | -0.20% | -0.12% | 0.19% | 0.04% | -0.12% | -0.35% | |
| AUD | 0.23% | -0.25% | -0.16% | 0.15% | -0.04% | -0.17% | -0.39% | |
| NZD | 0.39% | -0.09% | 0.00% | 0.31% | 0.12% | 0.17% | -0.22% | |
| CHF | 0.61% | 0.13% | 0.23% | 0.53% | 0.35% | 0.39% | 0.22% |
The heat map shows percentage changes of major currencies against each other. The base currency is picked from the left column, while the quote currency is picked from the top row. For example, if you pick the US Dollar from the left column and move along the horizontal line to the Japanese Yen, the percentage change displayed in the box will represent USD (base)/JPY (quote).
(The technical analysis of this story was written with the help of an AI tool.)

FXStreet
Plus d’un million d’utilisateurs se tournent vers FXStreet pour des données de marché en temps réel, des outils de graphiques, des analyses d’experts et des actualités Forex. Leur calendrier économique complet et leurs webinaires éducatifs aident les traders à rester informés et à prendre des décisions éclairées. FXStreet s’appuie sur une équipe d’environ 60 professionnels répartis entre le siège de Barcelone et diverses régions du monde.
Read More


