
Trade The World
USD/CAD Price Forecast: Tests 1.4000 barrier after breaking above nine-day EMA
Par Akhtar Faruqui
Date de publication: 31 Oct 2025 | Date de modification: 31 Oct 2025


POPULAR ARTICLES

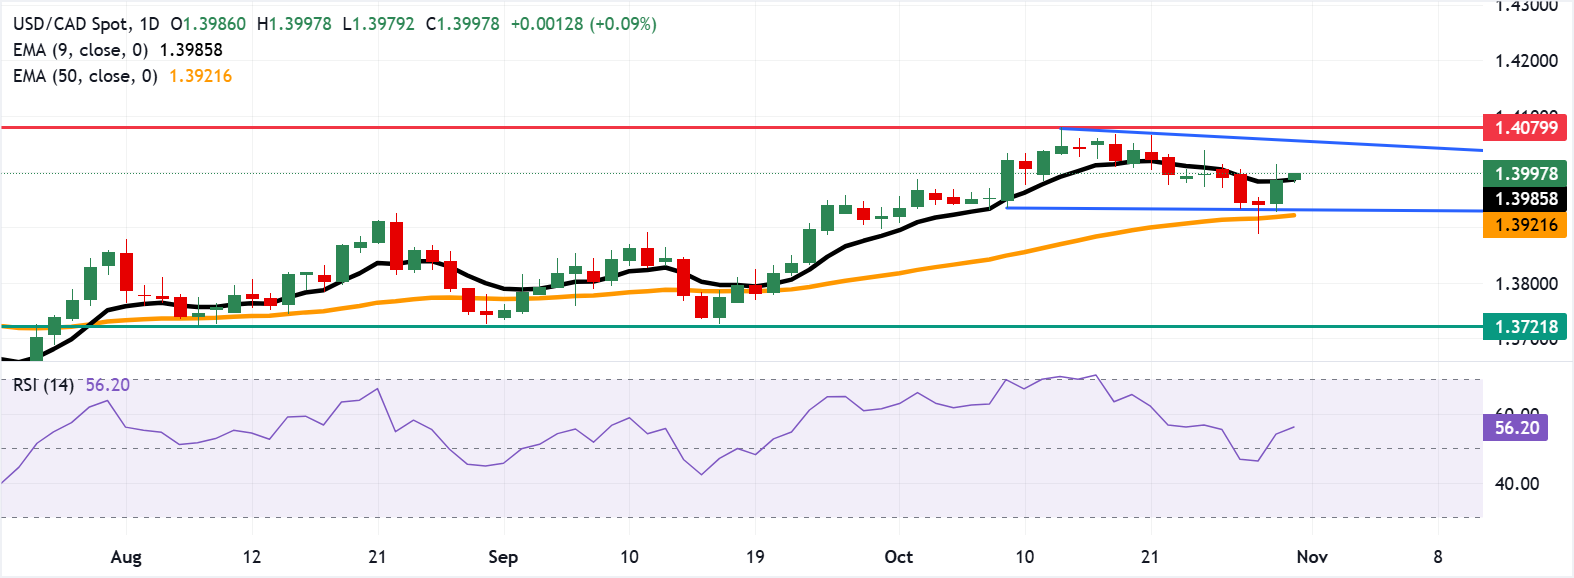
USD/CAD extends its gains for the second successive session, trading around 1.3990 during the early European hours on Friday. The technical analysis of the daily chart indicates a price consolidation, with the USD/CAD pair rebounding from the lower boundary of its rectangle pattern.
- USD/CAD tests the immediate resistance at the psychological level of 1.4000.
- Technical analysis of the daily chart suggests a price consolidation.
- The pair may find its initial support at the nine-day EMA of 1.3985.
USD/CAD extends its gains for the second successive session, trading around 1.3990 during the early European hours on Friday. The technical analysis of the daily chart indicates a price consolidation, with the USD/CAD pair rebounding from the lower boundary of its rectangle pattern.
The short-term price momentum is stronger as the pair is positioned above the nine-day Exponential Moving Average (EMA). Additionally, the 14-day Relative Strength Index (RSI) has moved above the 50 level, indicating a potential for a bullish revival.
On the upside, the immediate barrier appears at the psychological level of 1.4000. A break above this level would lead the USD/CAD pair to explore the region around the rectangle’s upper boundary, around 1.4060, followed by the six-month high of 1.4079, reached on October 14.
The primary support lies at the nine-day EMA of 1.3985, followed by the rectangle’s lower boundary around 1.3930 and the 50-day EMA at 1.3921. A break below this confluence support zone would cause the emergence of the bearish bias and open the doors for the USD/CAD pair to navigate the region around the “throwback support” near the three-month low of 1.3721, which was recorded on August 7.
USD/CAD: Daily Chart
Canadian Dollar Price Today
The table below shows the percentage change of Canadian Dollar (CAD) against listed major currencies today. Canadian Dollar was the weakest against the Euro.
| USD | EUR | GBP | JPY | CAD | AUD | NZD | CHF | |
|---|---|---|---|---|---|---|---|---|
| USD | -0.02% | 0.06% | 0.02% | 0.09% | 0.22% | 0.34% | 0.04% | |
| EUR | 0.02% | 0.07% | 0.05% | 0.11% | 0.24% | 0.36% | 0.06% | |
| GBP | -0.06% | -0.07% | -0.02% | 0.04% | 0.17% | 0.29% | -0.02% | |
| JPY | -0.02% | -0.05% | 0.02% | 0.05% | 0.19% | 0.30% | 0.00% | |
| CAD | -0.09% | -0.11% | -0.04% | -0.05% | 0.12% | 0.24% | -0.05% | |
| AUD | -0.22% | -0.24% | -0.17% | -0.19% | -0.12% | 0.12% | -0.18% | |
| NZD | -0.34% | -0.36% | -0.29% | -0.30% | -0.24% | -0.12% | -0.31% | |
| CHF | -0.04% | -0.06% | 0.02% | -0.00% | 0.05% | 0.18% | 0.31% |
The heat map shows percentage changes of major currencies against each other. The base currency is picked from the left column, while the quote currency is picked from the top row. For example, if you pick the Canadian Dollar from the left column and move along the horizontal line to the US Dollar, the percentage change displayed in the box will represent CAD (base)/USD (quote).

FXStreet
Plus d’un million d’utilisateurs se tournent vers FXStreet pour des données de marché en temps réel, des outils de graphiques, des analyses d’experts et des actualités Forex. Leur calendrier économique complet et leurs webinaires éducatifs aident les traders à rester informés et à prendre des décisions éclairées. FXStreet s’appuie sur une équipe d’environ 60 professionnels répartis entre le siège de Barcelone et diverses régions du monde.
Read More


