
Trade The World
USD/CHF Price Forecast: Sellers dominate as pair consolidates below key SMAs
Par Christian Borjon Valencia
Date de publication: 13 Sep 2025 | Date de modification: 13 Sep 2025


POPULAR ARTICLES

USD/CHF advanced during the North American session, yet it remains consolidating at around the 0.7950-0.8000 range ahead of the next week Federal Reserve’s monetary policy meeting. The pair trades at 0.7966 up 0.12%.
- USD/CHF up 0.12% but trades below 20- and 50-day SMA confluence at 0.8019/23, keeping sellers in control.
- RSI bearish but flat, suggesting near-term consolidation unless breakout above 0.8000 or drop below 0.7900 occurs.
- Upside targets include 0.8025 and 100-day SMA at 0.8109; downside risks point to yearly low at 0.7872.
USD/CHF advanced during the North American session, yet it remains consolidating at around the 0.7950-0.8000 range ahead of the next week Federal Reserve’s monetary policy meeting. The pair trades at 0.7966 up 0.12%.
USD/CHF Price Forecast: Technical outlook
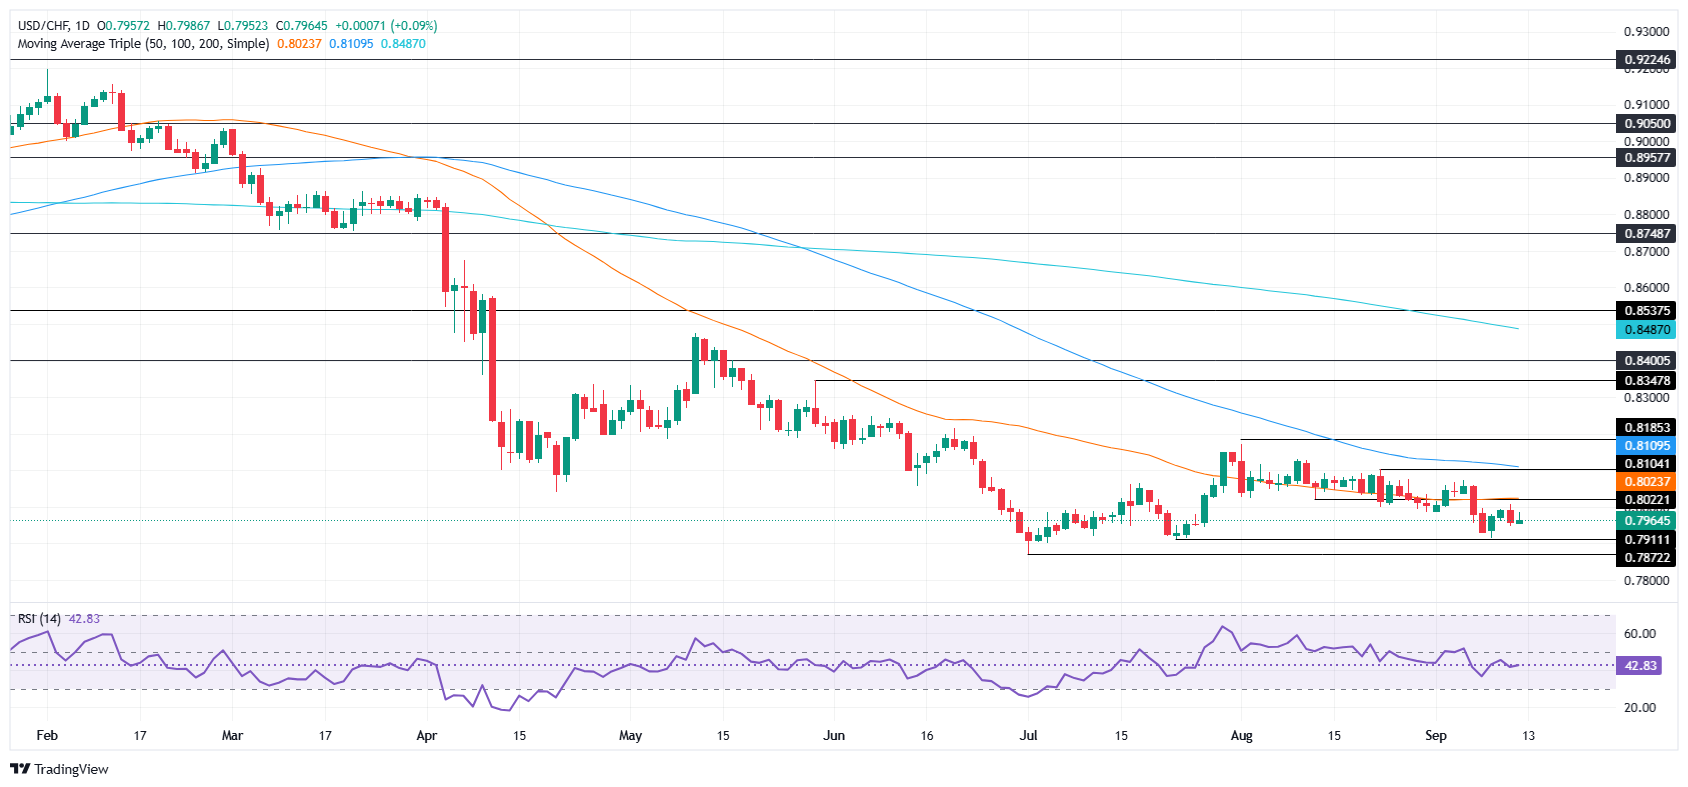
The USD/CHF daily chart shows that price action is poised to test yearly lows. Spot prices remain below the 20 and 50-day Simple Moving Averages (SMAs) confluence at 0.8019/23, an indication that sellers remain in charge.
The Relative Strength Index (RSI) is bearish, but flatlined. This means that the USD/CHF could be directionless in the short-term, unless the pair clear key support/resistance levels.
On the upside, if USD/CHF climbs above 0.8000, the next ceiling level would be 0.8025, before aiming towards the 100-day SMA at 0.8109. Conversely, a drop below 0.7900 would sponsor a test of the yearly low of 0.7872.
USD/CHF Price Chart — Daily
Swiss Franc Price This week
The table below shows the percentage change of Swiss Franc (CHF) against listed major currencies this week. Swiss Franc was the strongest against the Canadian Dollar.
| USD | EUR | GBP | JPY | CAD | AUD | NZD | CHF | |
|---|---|---|---|---|---|---|---|---|
| USD | -0.17% | -0.39% | -0.41% | 0.09% | -1.46% | -1.03% | -0.28% | |
| EUR | 0.17% | -0.23% | -0.14% | 0.29% | -1.29% | -0.81% | -0.11% | |
| GBP | 0.39% | 0.23% | 0.00% | 0.50% | -1.06% | -0.57% | 0.16% | |
| JPY | 0.41% | 0.14% | 0.00% | 0.42% | -1.10% | -0.80% | 0.17% | |
| CAD | -0.09% | -0.29% | -0.50% | -0.42% | -1.45% | -1.07% | -0.34% | |
| AUD | 1.46% | 1.29% | 1.06% | 1.10% | 1.45% | 0.48% | 1.24% | |
| NZD | 1.03% | 0.81% | 0.57% | 0.80% | 1.07% | -0.48% | 0.75% | |
| CHF | 0.28% | 0.11% | -0.16% | -0.17% | 0.34% | -1.24% | -0.75% |
The heat map shows percentage changes of major currencies against each other. The base currency is picked from the left column, while the quote currency is picked from the top row. For example, if you pick the Swiss Franc from the left column and move along the horizontal line to the US Dollar, the percentage change displayed in the box will represent CHF (base)/USD (quote).

FXStreet
Plus d’un million d’utilisateurs se tournent vers FXStreet pour des données de marché en temps réel, des outils de graphiques, des analyses d’experts et des actualités Forex. Leur calendrier économique complet et leurs webinaires éducatifs aident les traders à rester informés et à prendre des décisions éclairées. FXStreet s’appuie sur une équipe d’environ 60 professionnels répartis entre le siège de Barcelone et diverses régions du monde.
Read More


