


Key Takeaways
A pennant pattern is a continuation pattern that forms after a strong trend move and often breaks in the same direction.
A bullish pennant, also called a bull pennant, forms after a sharp upward move and often continues higher.
A bearish pennant pattern forms after a sharp downward move and often continues lower.
A valid pennant flag pattern usually includes a strong Flagpole, a tight Pennant (Consolidation), lower Volume during consolidation, and a breakout within a short Duration.
A pennant differs from a flag because a pennant contracts into converging trendlines, while a flag forms inside parallel trendlines.
Bullish and bearish pennant trades usually use the breakout point for entry, the opposite side of the pattern for risk, and the target based on the flagpole length.
What is the Pennant Flag Chart Pattern?
A pennant flag pattern is a continuation chart pattern in technical analysis that signals a temporary pause inside an existing trend. The pennant pattern begins with a strong directional move, then compresses into a small symmetrical triangle before price breaks out again.
Bullish Pennant Pattern
A bullish pennant pattern forms after a sharp upward move. Price then pauses in a tight triangle before breaking above resistance.
A bullish pennant suggests buyers still control the trend. The consolidation usually reflects profit taking, not reversal.
Bearish Pennant Pattern
A bearish pennant pattern forms after a sharp downward move. Price then pauses in a tight triangle before breaking below support.
A bearish pennant suggests sellers still control the trend. The consolidation usually reflects a pause, not reversal.
Bullish vs Bearish Comparison Table
Price Action Explained: Why Does Pennant Flag Pattern Form?
A pennant pattern forms because a strong move creates momentum, then the market pauses to absorb that move. Buyers and sellers briefly re-balance, but the re-balancing is usually temporary. This is the price action mechanism behind it.
In a bullish pennant, early buyers take profits while new buyers wait for confirmation. In a bearish pennant, early sellers cover positions while new sellers wait for price to break lower.
Components of a Pennant Pattern
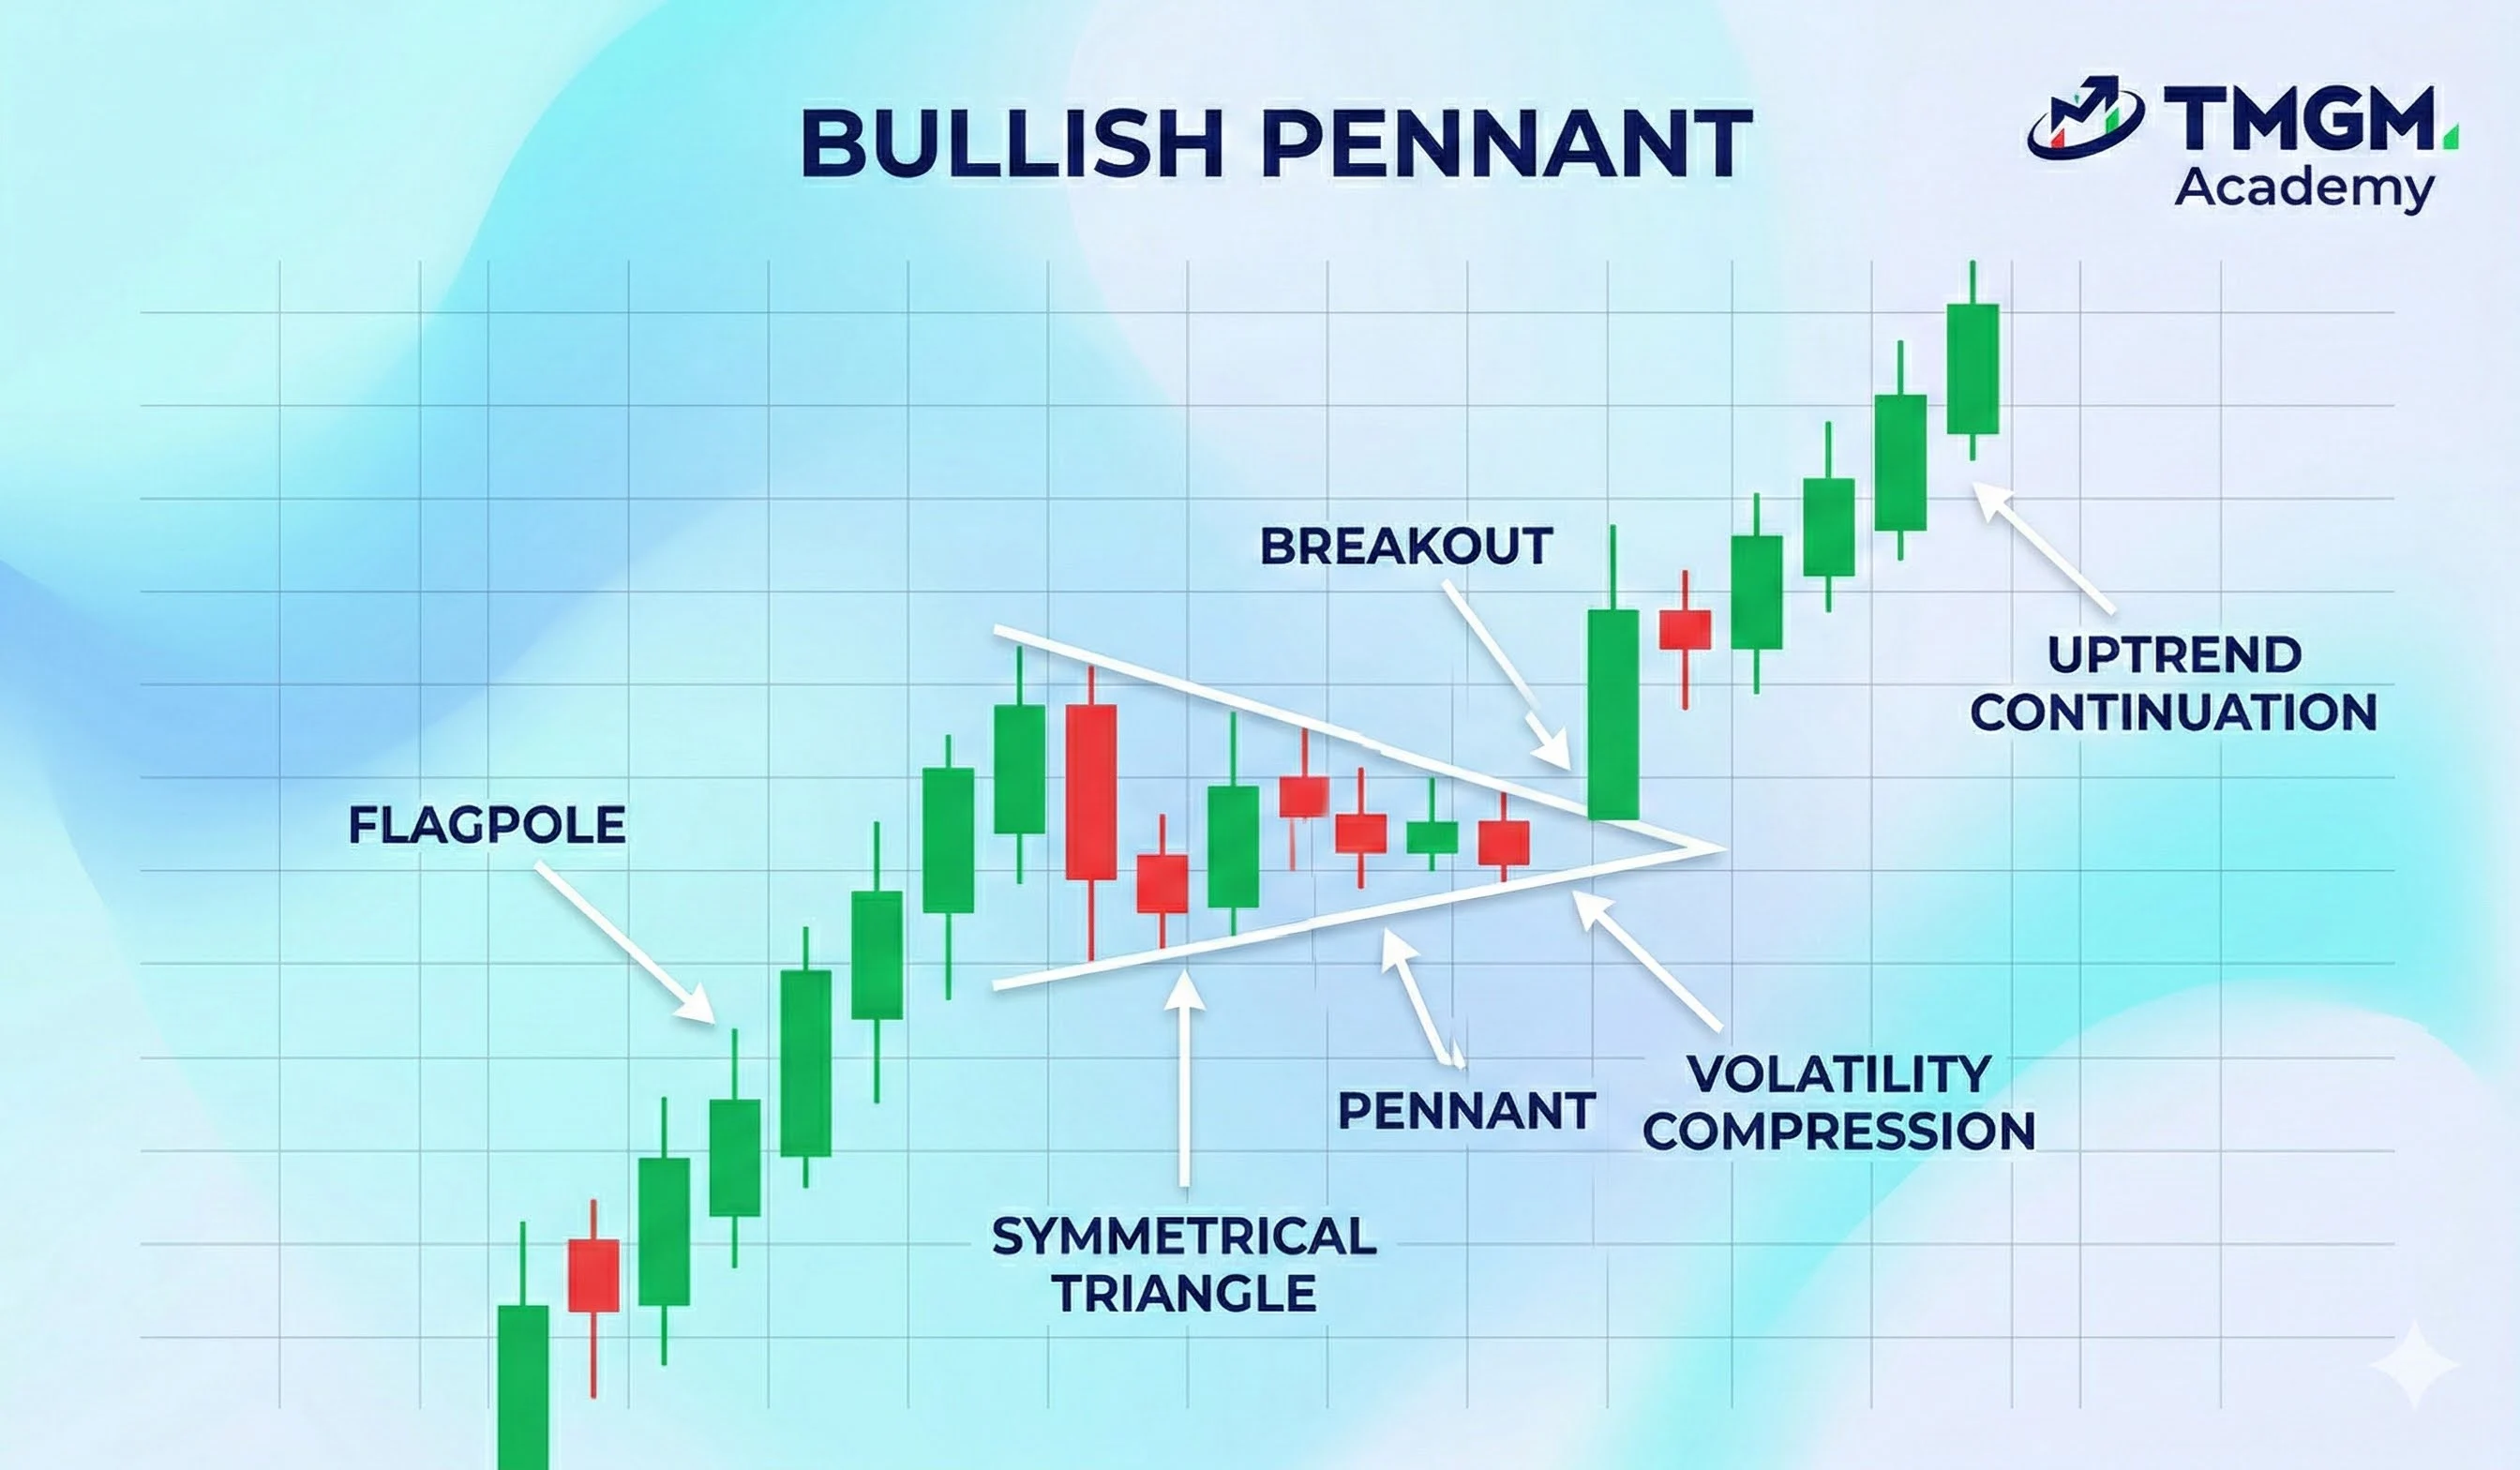
Flagpole: The flagpole is the sharp directional move that creates the momentum behind the pattern. It establishes the trend that the pennant is expected to continue.
Pennant: The pennant is the consolidation that follows the flagpole. It forms through converging trendlines as price compresses into a tighter range.
Breakout: The breakout confirms the pattern. It occurs when price closes beyond the pennant boundary in the direction of the original move, signaling potential trend continuation.
Pro Tip
A pennant should stay small relative to the flagpole. If the consolidation becomes too wide or lasts too long, momentum is weakening.
Pennant vs. Flag: What Is the Difference?
A pennant and a flag are both continuation patterns, but the consolidation shape is different. A pennant forms with a converging channel forming a triangle, while a flag forms with a parallel channel.
The easiest way to separate the two patterns is to look at the channel. If the lines form a triangle, the pattern is a pennant. If the lines stay parallel, the pattern is a flag.
Pennant vs. Flag Patterns Comparison Table
How to Trade Pennant Patterns
Bullish Pennant Pattern
A bullish pennant trade looks for continuation after a strong prior uptrend.
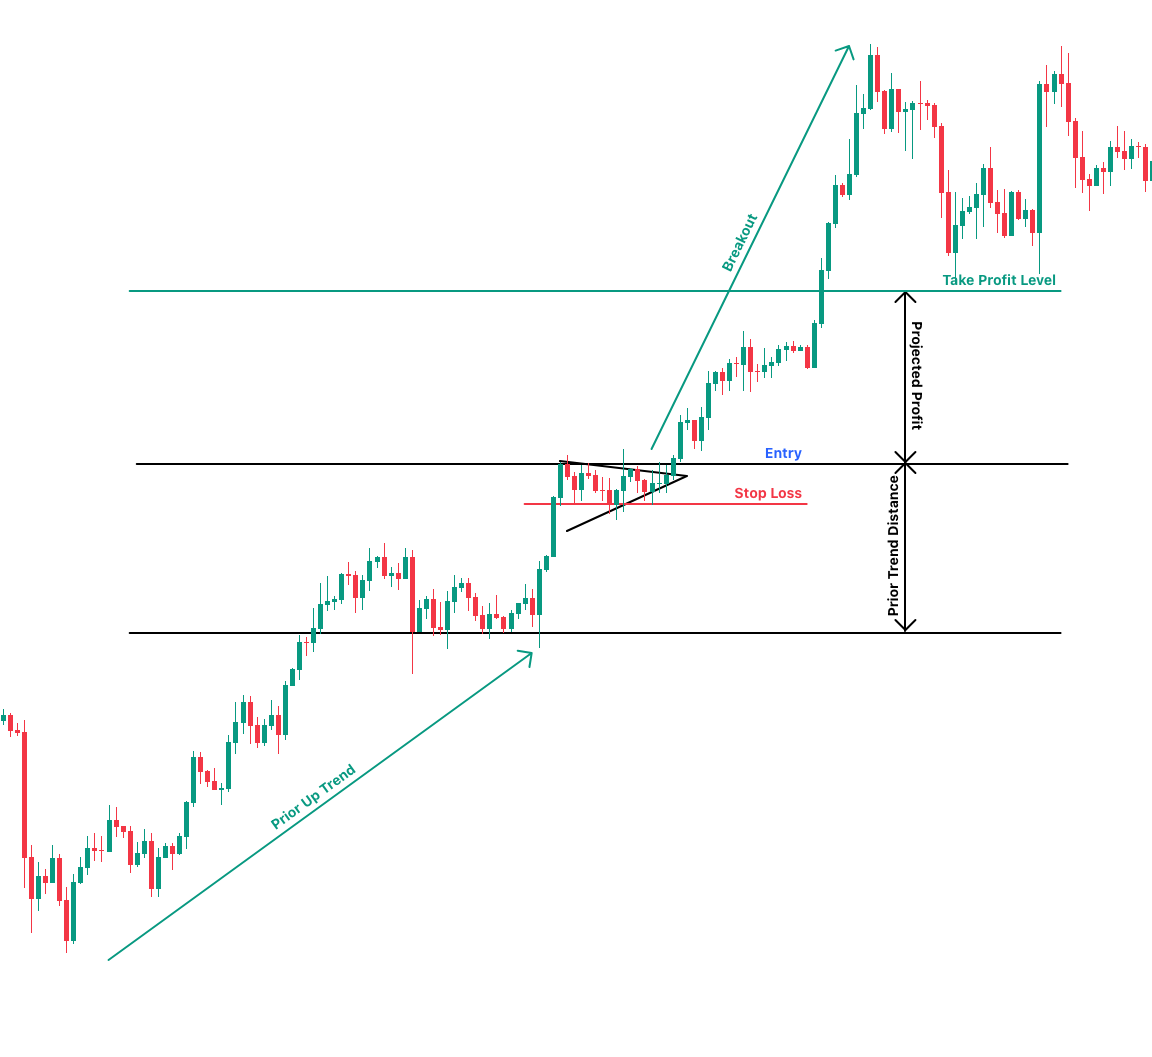
Entry
The entry is placed above the pennant swing high, which acts as the breakout trigger level.
Confirmation
Confirmation comes from a clean breakout above the pennant and immediate bullish follow through.
Stop Loss
The stop loss is placed below the pennant swing low. That level acts as the invalidation point because a break below it means the pattern has failed.
Target
When no clear major resistance is available ahead, the target can be set with a measured move. In this case, measure the prior trend distance from the recent major support to the pennant swing high and project that same distance upward from the breakout level.
Example
If the flagpole measures 100 points, the projected target sits about 100 points above the breakout level.
Common Mistakes and How to Avoid Them
Some common mistakes made by beginners are avoidable but repeatable in many cases. Here are some top mistakes to be aware of:
Ignoring Volume on the Breakout
Ignoring Volume removes an important confirmation factor. A breakout with stronger Volume usually has better support.
Confusing a Pennant With a Symmetrical Triangle
A pennant and a symmetrical triangle can look similar, but the context is different. A pennant follows a sharp flagpole, while a symmetrical triangle does not require that prior impulse move..
Risk Management for Pennant Trades
How Much to Risk Per Trade
Each trade should risk only a small part of total capital. Small position risk helps preserve capital during losing streaks.
Capital preservation matters because even good patterns fail.
Position Sizing for Beginners
Position sizing should be adjusted by pre-calculating the potential downside before entering the position. A wider stop requires a smaller position.
A simple process helps:
Define the entry price.
Define the stop loss price.
Measure the gap between entry and stop.
Reduce position size until the maximum loss matches the risk limit amount per trade.
FAQ
What is the flag and pennant pattern?
A flag and pennant are both continuation patterns that form after a strong price move. A flag consolidates inside parallel trendlines, while a pennant pattern consolidates inside converging trendlines.
What is a pennant flag?
A pennant flag usually refers to a pennant pattern in search queries, but a pennant and a flag are not the same pattern. A pennant is a continuation pattern that forms after a sharp move, pauses in a small symmetrical triangle, and then often breaks in the direction of the prior trend.
Is a pennant bullish or bearish?
A pennant can be Bullish or Bearish. A bullish pennant forms after a strong rise, while a bearish pennant pattern forms after a strong drop.
What is the difference between a flag and a pennant?
The main difference is the shape of the consolidation. A flag forms in a short channel with parallel trendlines, while a pennant forms in a tightening triangle with converging trendlines.


