
AUD/JPY rebounds from daily lows, eyes 111.70 for bullish breakout
Oleh Christian Borjon Valencia
Tanggal Diterbitkan: 4 Mar 2026 | Tanggal Dimodifikasi: 4 Mar 2026


ARTIKEL POPULER

The AUD/JPY trims some of its earlier but is ending the session on a normal note, down 0.63%, after bouncing off daily lows below the 111.00 figure. At the time of writing, the cross-pair trades at 110.89.
- AUD/JPY falls 0.63% to 110.89 after rebounding from 109.53 low.
- Break above 111.70 targets 112.09 YTD high, then 112.50.
- Drop below 110.00 exposes 109.79 (20-day SMA) and 108.80 support.
The AUD/JPY trims some of its earlier but is ending the session on a normal note, down 0.63%, after bouncing off daily lows below the 111.00 figure. At the time of writing, the cross-pair trades at 110.89.
AUD/JPY Price Forecast: Technical outlook
Volatility drove price action within a wide-trading range ─of 250 pips or 2%, on Tuesday as the Middle East conflict favored a flight to safety. Hence, the Japanese Yen appreciated versus the Aussie Dollar.
Despite turning mildly bearish during the day and reaching a daily low of 109.53, the AUD/JPY pair recovered, ending past the 110.50 figure, above the February 9 daily high of 110.79.
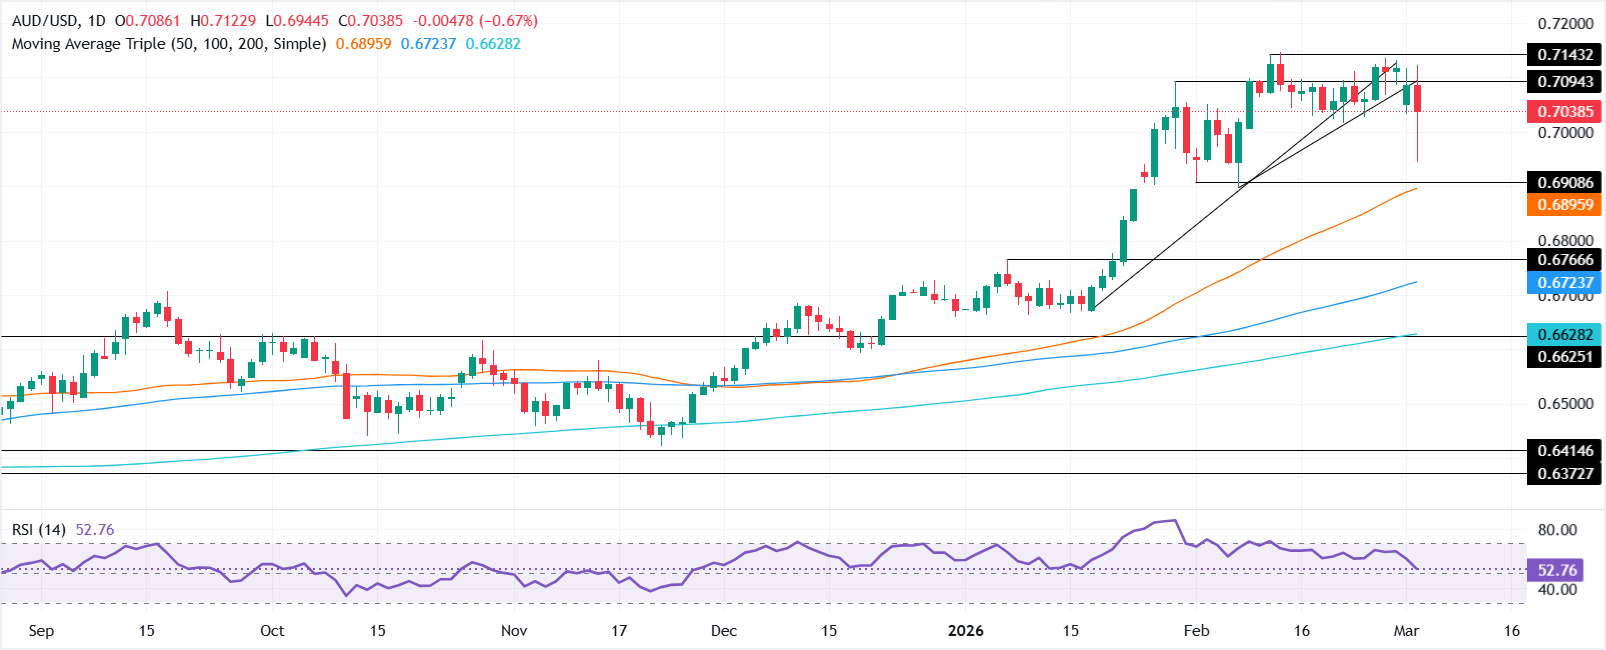
For a bullish continuation, the pair needs to clear the previous yearly high of 111.70 ahead of challenging the current yearly high of 112.09. Once cleared the next stop would be 112.50 ahead of 113.00.
On the downside, if the AUD/JPY dives below 110.00, it opens the door to test the 20-day SMA at 109.79. A breach of the latter will expose the February 23 daily low of 108.80.
AUD/JPY Price Chart – Daily
Japanese Yen Price This week
The table below shows the percentage change of Japanese Yen (JPY) against listed major currencies this week. Japanese Yen was the strongest against the Swiss Franc.
| USD | EUR | GBP | JPY | CAD | AUD | NZD | CHF | |
|---|---|---|---|---|---|---|---|---|
| USD | 1.33% | 0.50% | 1.01% | 0.24% | 0.23% | 1.14% | 1.85% | |
| EUR | -1.33% | -0.84% | -0.35% | -1.07% | -1.09% | -0.18% | 0.53% | |
| GBP | -0.50% | 0.84% | 0.29% | -0.25% | -0.28% | 0.66% | 1.39% | |
| JPY | -1.01% | 0.35% | -0.29% | -0.70% | -0.72% | 0.22% | 0.95% | |
| CAD | -0.24% | 1.07% | 0.25% | 0.70% | -0.05% | 0.93% | 1.64% | |
| AUD | -0.23% | 1.09% | 0.28% | 0.72% | 0.05% | 0.91% | 1.66% | |
| NZD | -1.14% | 0.18% | -0.66% | -0.22% | -0.93% | -0.91% | 0.74% | |
| CHF | -1.85% | -0.53% | -1.39% | -0.95% | -1.64% | -1.66% | -0.74% |
The heat map shows percentage changes of major currencies against each other. The base currency is picked from the left column, while the quote currency is picked from the top row. For example, if you pick the Japanese Yen from the left column and move along the horizontal line to the US Dollar, the percentage change displayed in the box will represent JPY (base)/USD (quote).

Acuity Trading adalah perusahaan fintech berbasis di London yang didirikan pada 2013, fokus pada data alternatif berbasis AI dan analisis sentimen untuk trading dan investasi. Mereka merevolusi pengalaman trading online dengan alat berita dan sentimen visual, dan kini terus memimpin pasar dengan data alternatif penghasil alfa dan alat trading interaktif tinggi berbasis riset dan teknologi AI terbaru.
Baca Selengkapnya


