
Tron Price Forecast: TRX targets $0.32 following wedge breakout, Deribit options launch
Oleh Manish Chhetri
Tanggal Diterbitkan: 15 Jan 2026 | Tanggal Dimodifikasi: 15 Jan 2026


ARTIKEL POPULER

Tron (TRX) price rebounds, trading above $0.30 on Thursday, following a retest of the previously broken upper boundary of a falling wedge pattern. The bullish narrative strengthened as the Derbit platform launched the TRX option for investors.
- Tron price rebounds slightly after retesting a previously broken upper boundary of a falling wedge pattern.
- TRX options launch on the Deribit platform highlights growing investor interest in the token.
- On-chain data support bullish sentiment, with TRX stablecoin market capitalization rising steadily alongside large whale orders.
Tron (TRX) price rebounds, trading above $0.30 on Thursday, following a retest of the previously broken upper boundary of a falling wedge pattern. The bullish narrative strengthened as the Derbit platform launched the TRX option for investors. Meanwhile, the price action suggests an upside move, supported by rising stablecoin market capitalization and large whale orders.
Derbit launches TRX options
Deribit by Coinbase, a leading digital asset derivatives exchange, announced on Wednesday the launch of TRX options trading on its platform. The new listing offers two daily, two weekly, one monthly, and one quarterly expiry, further expanding institutional-grade derivatives access to the TRON ecosystem.
The news is broadly bullish for TRON’s native token, TRX, over the long term, as it enhances network adoption, improves liquidity and expands the token’s utility across payment ecosystems.
In the short term, traders responded modestly, with TRX trading steadily around $0.30 following the announcement.
Tron on-chain data shows bullish bias
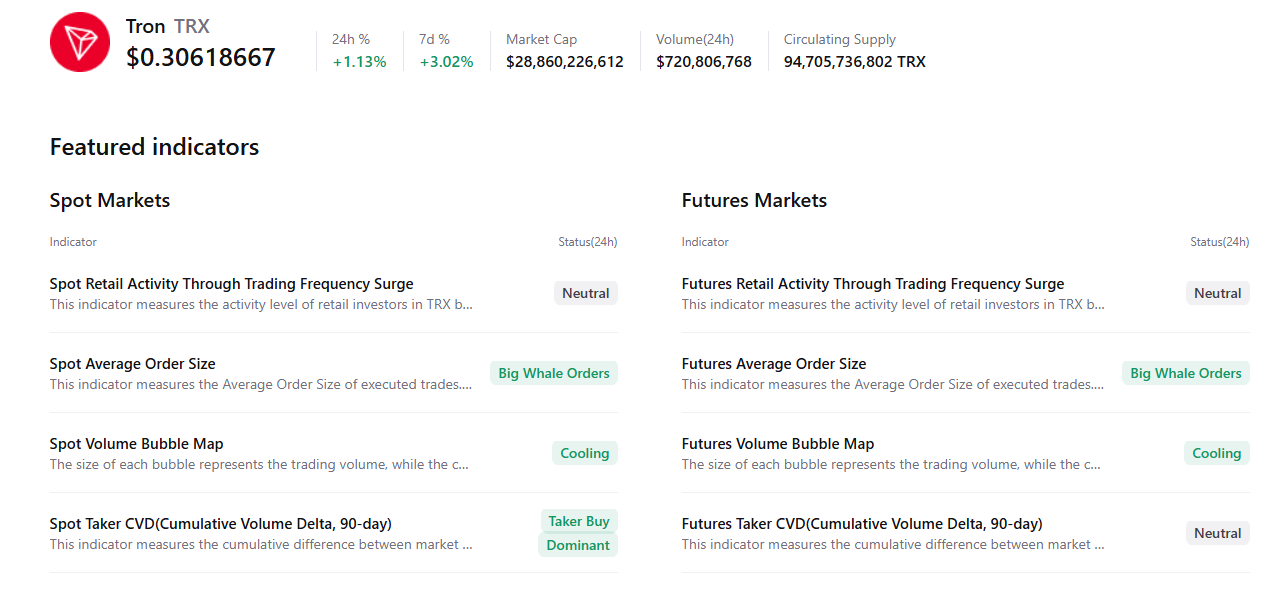
The CryptoQuant chart below supports a positive outlook, as TRX’s spot and futures markets show large whale orders and cooling conditions, signaling a potential rally ahead.
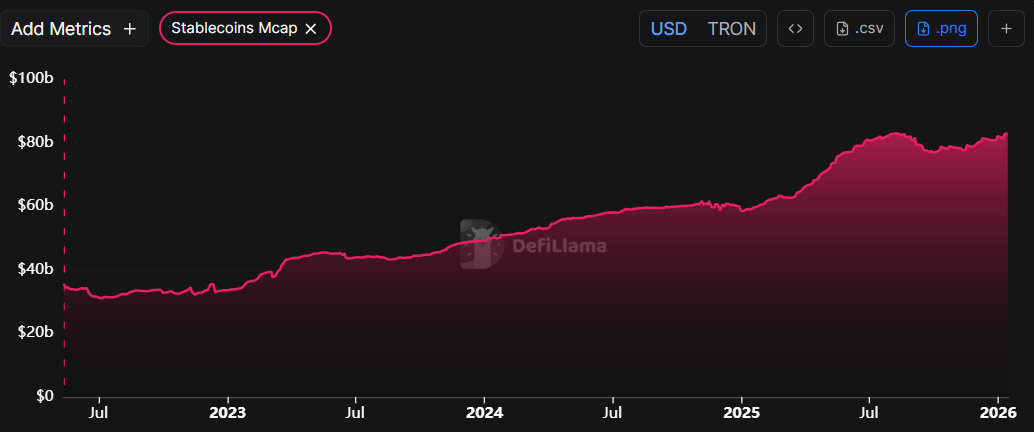
DefiLama data shows that TRX’s stablecoin total supply has risen since the end of December and currently stands at $82.85 billion, nearing the record high of $83 billion in early August. Such stablecoin activity and value increase on the Tron project indicate a bullish outlook, as they boost network usage and can attract more users to the ecosystem.
Tron Price Forecast: TRX bulls aiming for the $0.32 mark
Tron price broke above the falling wedge pattern (drawn by joining multiple highs and lows since the end of August) on Tuesday and declined the next day, retesting the upper trendline boundary. As of writing on Thursday, TRX is trading at $0.30.
If TRX continues its upward trend, it could extend the rally toward the October 22 high of $0.32.
The Relative Strength Index (RSI) on the daily chart reads 67, above the neutral level of 50, indicating bullish momentum is gaining traction. In addition, the Moving Average Convergence Divergence (MACD) indicator shows a bullish crossover and rising green histogram bars above the neutral level, further supporting the bullish outlook.
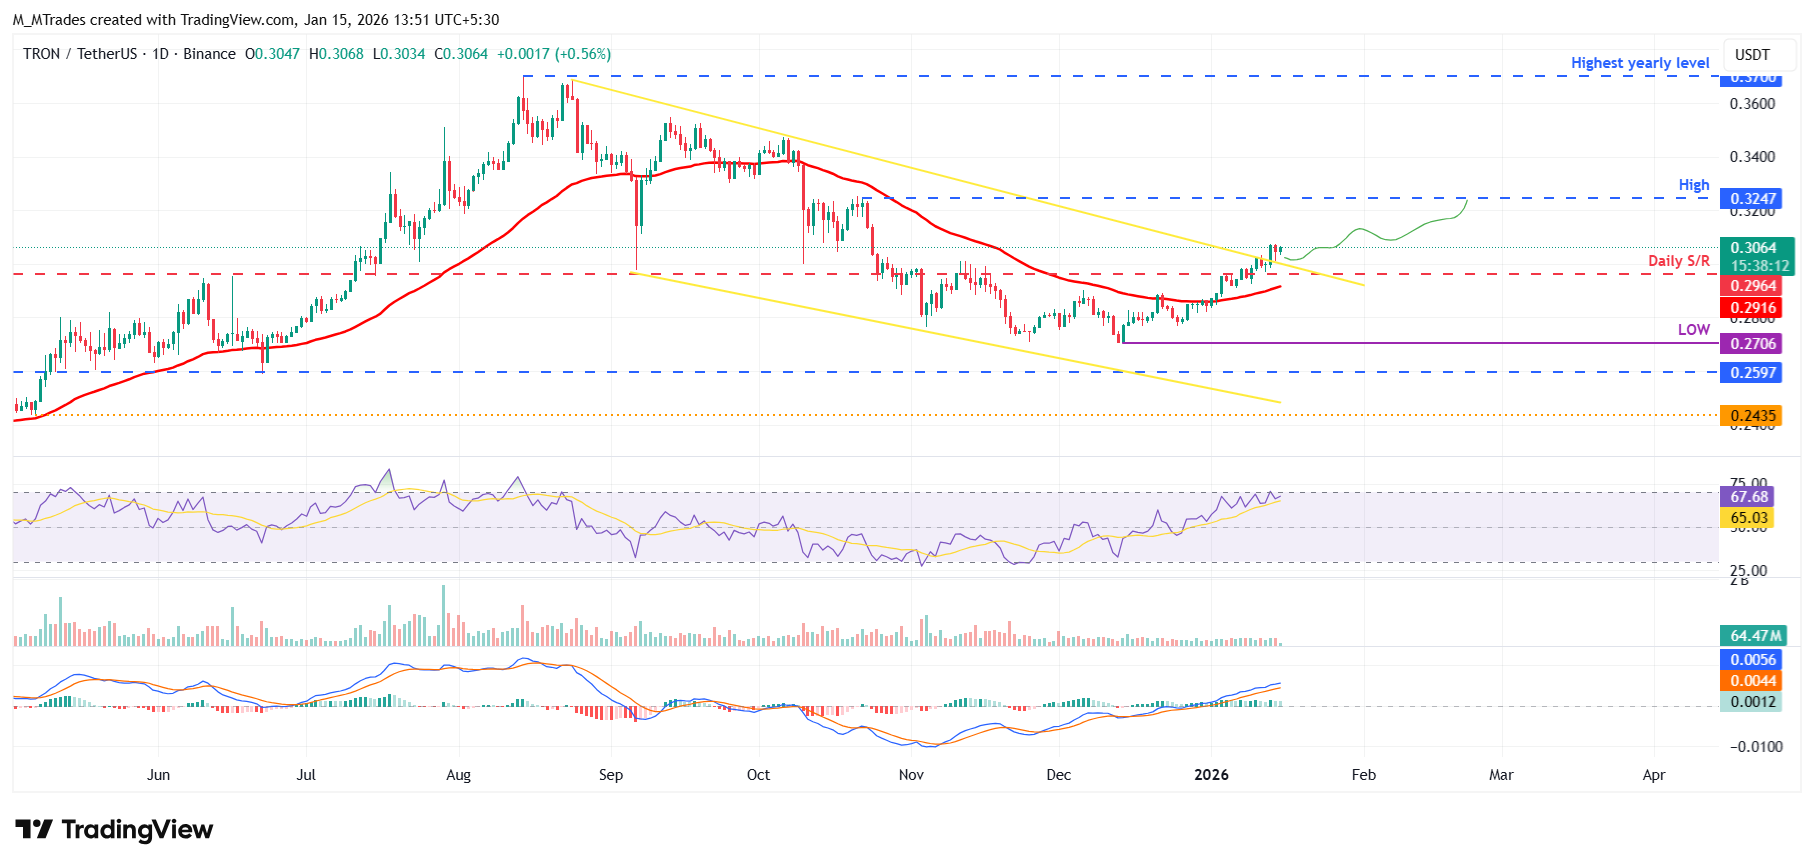
However, if TRX faces a correction, it could extend the decline toward the daily support at $0.29.

Acuity Trading adalah perusahaan fintech berbasis di London yang didirikan pada 2013, fokus pada data alternatif berbasis AI dan analisis sentimen untuk trading dan investasi. Mereka merevolusi pengalaman trading online dengan alat berita dan sentimen visual, dan kini terus memimpin pasar dengan data alternatif penghasil alfa dan alat trading interaktif tinggi berbasis riset dan teknologi AI terbaru.
Baca Selengkapnya


