
AUD/USD Price Forecast: Holds near 0.7090 with bullish pressure mounting
Oleh Guillermo Alcala
Diperbarui: 15 Jun 2026


ARTIKEL POPULER

The Australian Dollar (AUD) trims previous gains against the US Dollar (USD) on Monday, as markets ponder the peace agreement between the US and Iran, ahead of a central bank-busy week.
- AUD/USD holds gains at the upper range of the 0.7000s, buoyed by risk appetite and lower Oil prices.
- Risk-sensitive assets rally on Monday amid news of a US-Iran peace agreement.
- The pair has broken above trendline resistance, hinting at a deeper bullish correction.
The Australian Dollar (AUD) trims previous gains against the US Dollar (USD) on Monday, as markets ponder the peace agreement between the US and Iran, ahead of a central bank-busy week. The AUD/USD pair has pulled back from session highs at 0.7090 but remains positive on daily charts, with technical indicators showing moderate bullish momentum.
Investors celebrated the announcement of a peace deal between the US and Iran and the ensuing decline in Oil prices during Monday’s Asian and early European sessions. The risk-sensitive Aussie was one of the best performers, reaching 10-day highs at 0.7090 before pulling back to the 0.7070 area at the time of writing.
Markets, however, are reluctant to place large AUD/USD directional bets ahead of monetary policy decisions by the Reserve Bank of Australia (RBA) on Tuesday and the US Federal Reserve (Fed) on Wednesday. The Australian central bank is expected to stand pat after three consecutive rate hikes, although another hike remains in the cards. The Fed, on the contrary, is widely expected to leave rates on hold, with the new chairman, Kevin Warsh, likely to adopt a more dovish stance than former chief Jerome Powell.
Technical Analysis: Consolidates at near-term highs
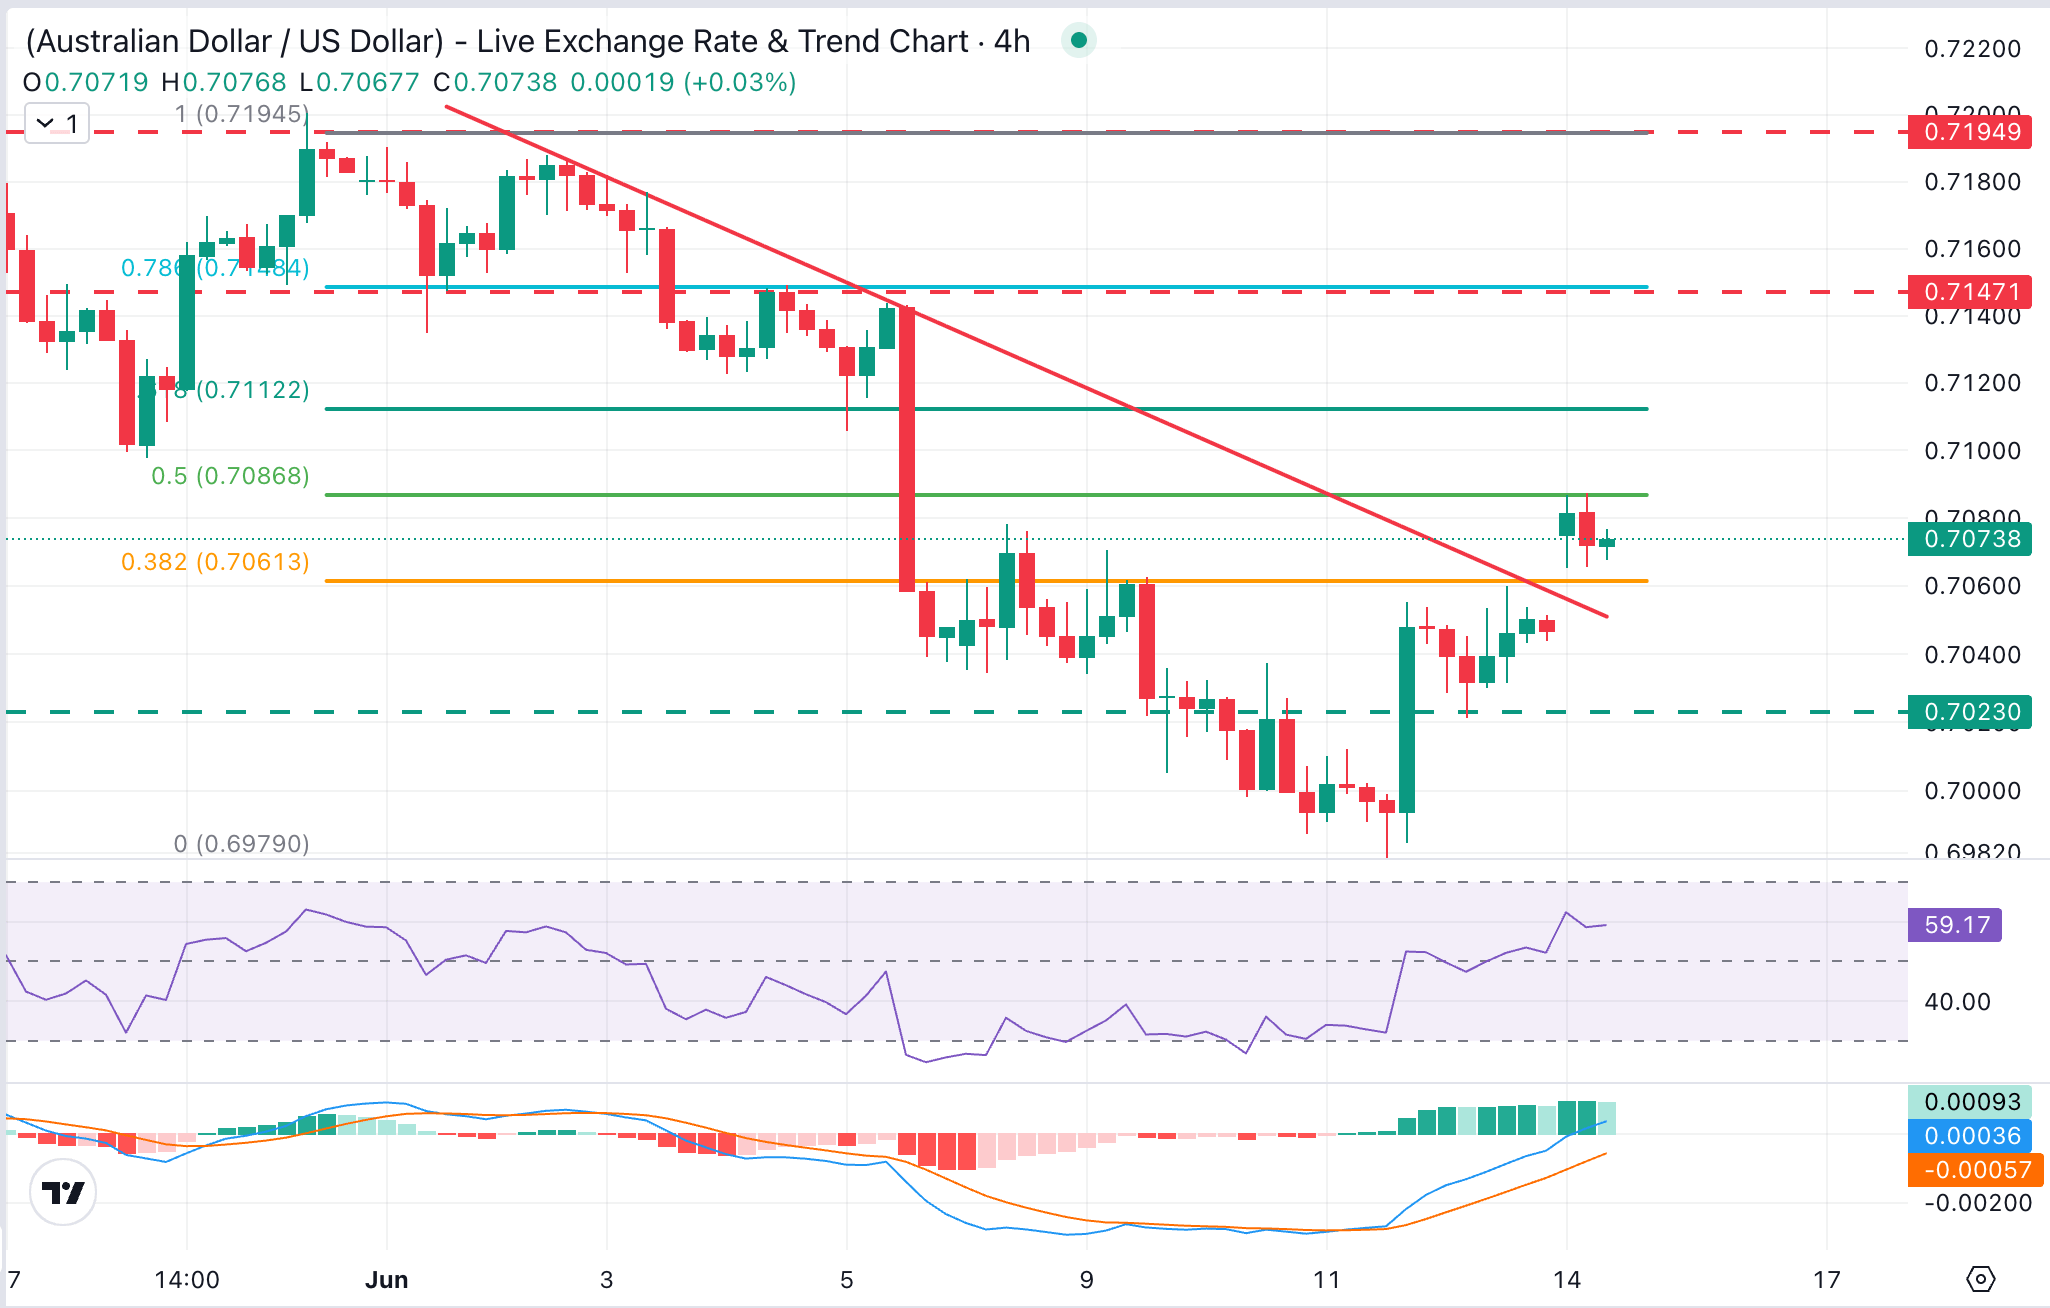
AUD/USD trades at 0.7072, maintaining a constructive near-term bias as it holds above the descending trendline resistance from early June highs. The Relative Strength Index (RSI) sits in the upper mid-range, while the Moving Average Convergence Divergence (MACD) remains in positive territory, together suggesting that bullish momentum is still intact.
On the topside, immediate resistance emerges at the 50% Fibonacci retracement near 0.7090, followed by the 61.8% retracement around 0.7113, with stronger caps at the horizontal barrier of 0.7145, where June 4, and 5 highs meet the 78.6% Fibonacci retracement.
Initial support is seen at the area between 38.2% retracement near 0.7060 and the reverse trendline, now around 0.7050. A clear break below those levels would put bears back in control and expose Friday's lows, at 0.7020, and the two-month lows, near 0.6980, hit last week.
(The technical analysis of this story was written with the help of an AI tool.)

Lebih dari satu juta pengguna mengandalkan FXStreet untuk data pasar real-time, alat charting, wawasan ahli, dan berita forex. Kalender ekonomi komprehensif dan webinar edukatif membantu trader tetap mendapat informasi dan membuat keputusan terukur. FXStreet memiliki sekitar 60 profesional yang tersebar antara kantor pusat Barcelona dan berbagai wilayah global.
Baca Selengkapnya


