
Cosmos Hub Price Forecast: ATOM rebounds slightly, bearish outlook remains intact
Oleh Manish Chhetri
Tanggal Diterbitkan: 25 Feb 2026 | Tanggal Dimodifikasi: 25 Feb 2026


ARTIKEL POPULER

Cosmos Hub (ATOM) price rebounds, trading above $2.05 at the time of writing on Wednesday, after undergoing a sharp correction since last week. Weakening on-chain and derivatives data support a bearish outlook, while technical analysis remains unfavorable.
- Cosmos Hub price rebounds slightly on Wednesday after posting four consecutive days of losses totaling more than 15% since last week.
- On-chain and derivatives data paint a bearish outlook, as ATOM’s social dominance declines alongside negative funding rates and rising short bets.
- The technical outlook is tilted to the downside, with price action pointing toward a near-term target at $1.84 if selling pressure persists.
Cosmos Hub (ATOM) price rebounds, trading above $2.05 at the time of writing on Wednesday, after undergoing a sharp correction since last week. Weakening on-chain and derivatives data support a bearish outlook, while technical analysis remains unfavorable.
ATOM selling pressure persists
Santiment’s Social Dominance metric for Cosmos Hub supports a bearish outlook. The index measures the share of ATOM-related discussions across the cryptocurrency media. It has been in a downward trend since mid-January, falling again in February to 0.416% on Wednesday. This fall indicates fading market interest and weakening sentiment among ATOM investors.
 [10-1771996583308-1771996583309.03.02, 25 Feb, 2026].png)
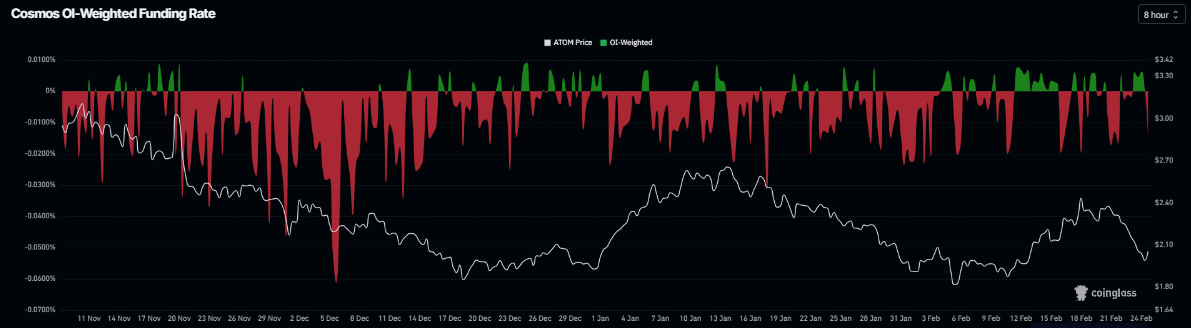
On the derivatives side, ATOM’s negative funding rates further project bearish sentiment. The metric turns negative on Wednesday and stands at -0.0147%, nearing levels seen on Sunday, when ATOM prices dropped sharply the next day. The negative ratio suggests that shorts are paying longs, suggesting bearish sentiment toward Cosmos Hub.
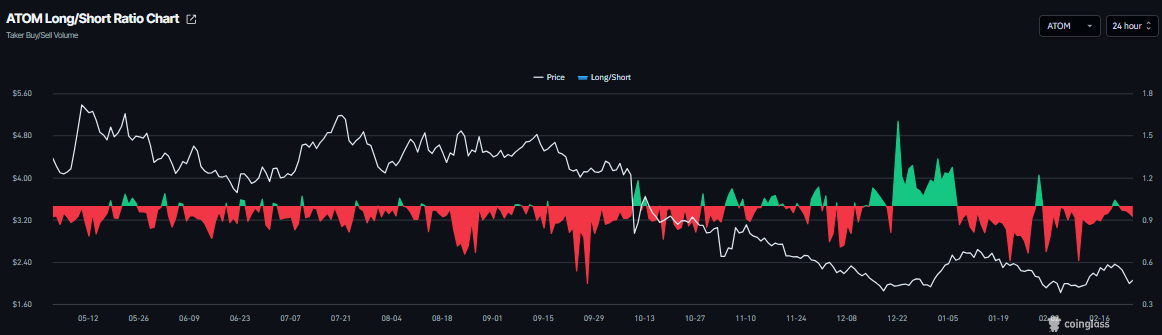
In addition, ATOM’s long-to-short ratio stood at 0.92 on Wednesday and has been above 1 only once this month, signaling that traders are reluctant to add long positions. This ratio below 1 indicates bearish sentiment as traders are betting on the Cosmos Hub price to fall.
Cosmos Hub Price Forecast: ATOM bears cap recovery
ATOM is trading at $2.05 as of writing on Wednesday. The near-term tone turns cautiously bullish after the rebound from sub-$2.00 levels, though price still trades well below the 50- and 100-day Exponential Moving Averages (EMAs), which are clustered above $2.19 and $2.39 and cap the broader trend.
The Relative Strength Index (RSI) at 44 recovers from oversold territory and points higher, hinting at improving but not yet dominant buying pressure. The Moving Average Convergence Divergence (MACD) line has slipped marginally below the signal line and back toward the zero mark, while the histogram has contracted, tempering upside conviction and suggesting an emerging consolidation phase after the recent bounce.
Immediate support aligns at the 38.2% Fibonacci retracement of the $1.65–$2.70 advance at $2.05, where the current price is attempting to stabilize, followed by stronger support at the prior horizontal floor around $1.83.
A sustained hold above $2.05 would keep the corrective recovery in play and open the way toward initial resistance at the 50% retracement at $2.17, with the 61.8% retracement at $2.29 next and the horizontal resistance at $2.57 guarding the upper boundary of the range.
On the downside, a daily close below $2.05 would expose the 23.6% retracement at $1.90 and shift the focus back to the lower support band near $1.83.
(The technical analysis of this story was written with the help of an AI tool.)

Lebih dari satu juta pengguna mengandalkan FXStreet untuk data pasar real-time, alat charting, wawasan ahli, dan berita forex. Kalender ekonomi komprehensif dan webinar edukatif membantu trader tetap mendapat informasi dan membuat keputusan terukur. FXStreet memiliki sekitar 60 profesional yang tersebar antara kantor pusat Barcelona dan berbagai wilayah global.
Baca Selengkapnya


