
Crude Oil sells the Iran peace deal sight unseen, WTI hits 15-week low
Oleh Joshua Gibson
Diperbarui: 16 Jun 2026


ARTIKEL POPULER

West Texas Intermediate (WTI) Crude Oil is in free fall, and the market is not waiting for confirmation.
- WTI fell to a 15-week low as markets priced an imminent US-Iran peace deal.
- The memorandum is still unsigned, and the two sides disagree on what it contains.
- An earlier round of talks already collapsed into a US naval blockade this year.
West Texas Intermediate (WTI) Crude Oil is in free fall, and the market is not waiting for confirmation. Front-month futures dropped roughly 5.8% on the day to test the $75 area, the lowest since early March, after Washington and Tehran signaled a draft peace framework that would lift the US naval blockade and let Iranian barrels return to market. Brent's August contract slid in step, dipping below $79 in its first move under $80 since March. The selloff is told as a supply story, yet no supply has moved; what has moved is conviction the deal is done.
A peace dividend paid before the signature
The trouble is that nobody outside the negotiating rooms has seen the text. Officials describe a memorandum of understanding (MOU) covering a reopened Strait of Hormuz, a lifted blockade, caps on Iran's nuclear work and a release of frozen assets, with the harder questions pushed into a 60-day follow-on negotiation. The US side has talked up a signing ceremony in Geneva on Friday and a Strait that reopens free of Iranian tolls, while Tehran's account of the terms has not lined up cleanly with Washington's. A former US energy adviser put it plainly this week, calling it odd to be told an agreement was struck days ago with no document yet produced. The market has decided to price the press release rather than the paper.
Burned on this script before
This is not the tape's first rally on Iranian peace noise this year, and the earlier episodes did not end well. A February thaw faded, an April ceasefire broke down, and a failed round of talks in the spring is precisely what triggered the naval blockade now in place. US officials themselves put the odds of a signature at around 80%, conceding Iran's internal politics are unpredictable, and the past week has brought street protests against the deal in Tehran alongside fresh threats of retaliation. The physical picture argues for caution, not optimism. Through mid-June, tracking showed the blockade still largely intact, with laden tankers stalled off Chabahar. According to reporting by an NGO in the region, one loaded supertanker has since cleared the cordon out of Chabahar, though the source is hardly neutral and one tanker is not a resumption of flows. The $5 repricing assumes a clean signing the recent record says is anything but guaranteed.
A clean break with air beneath it
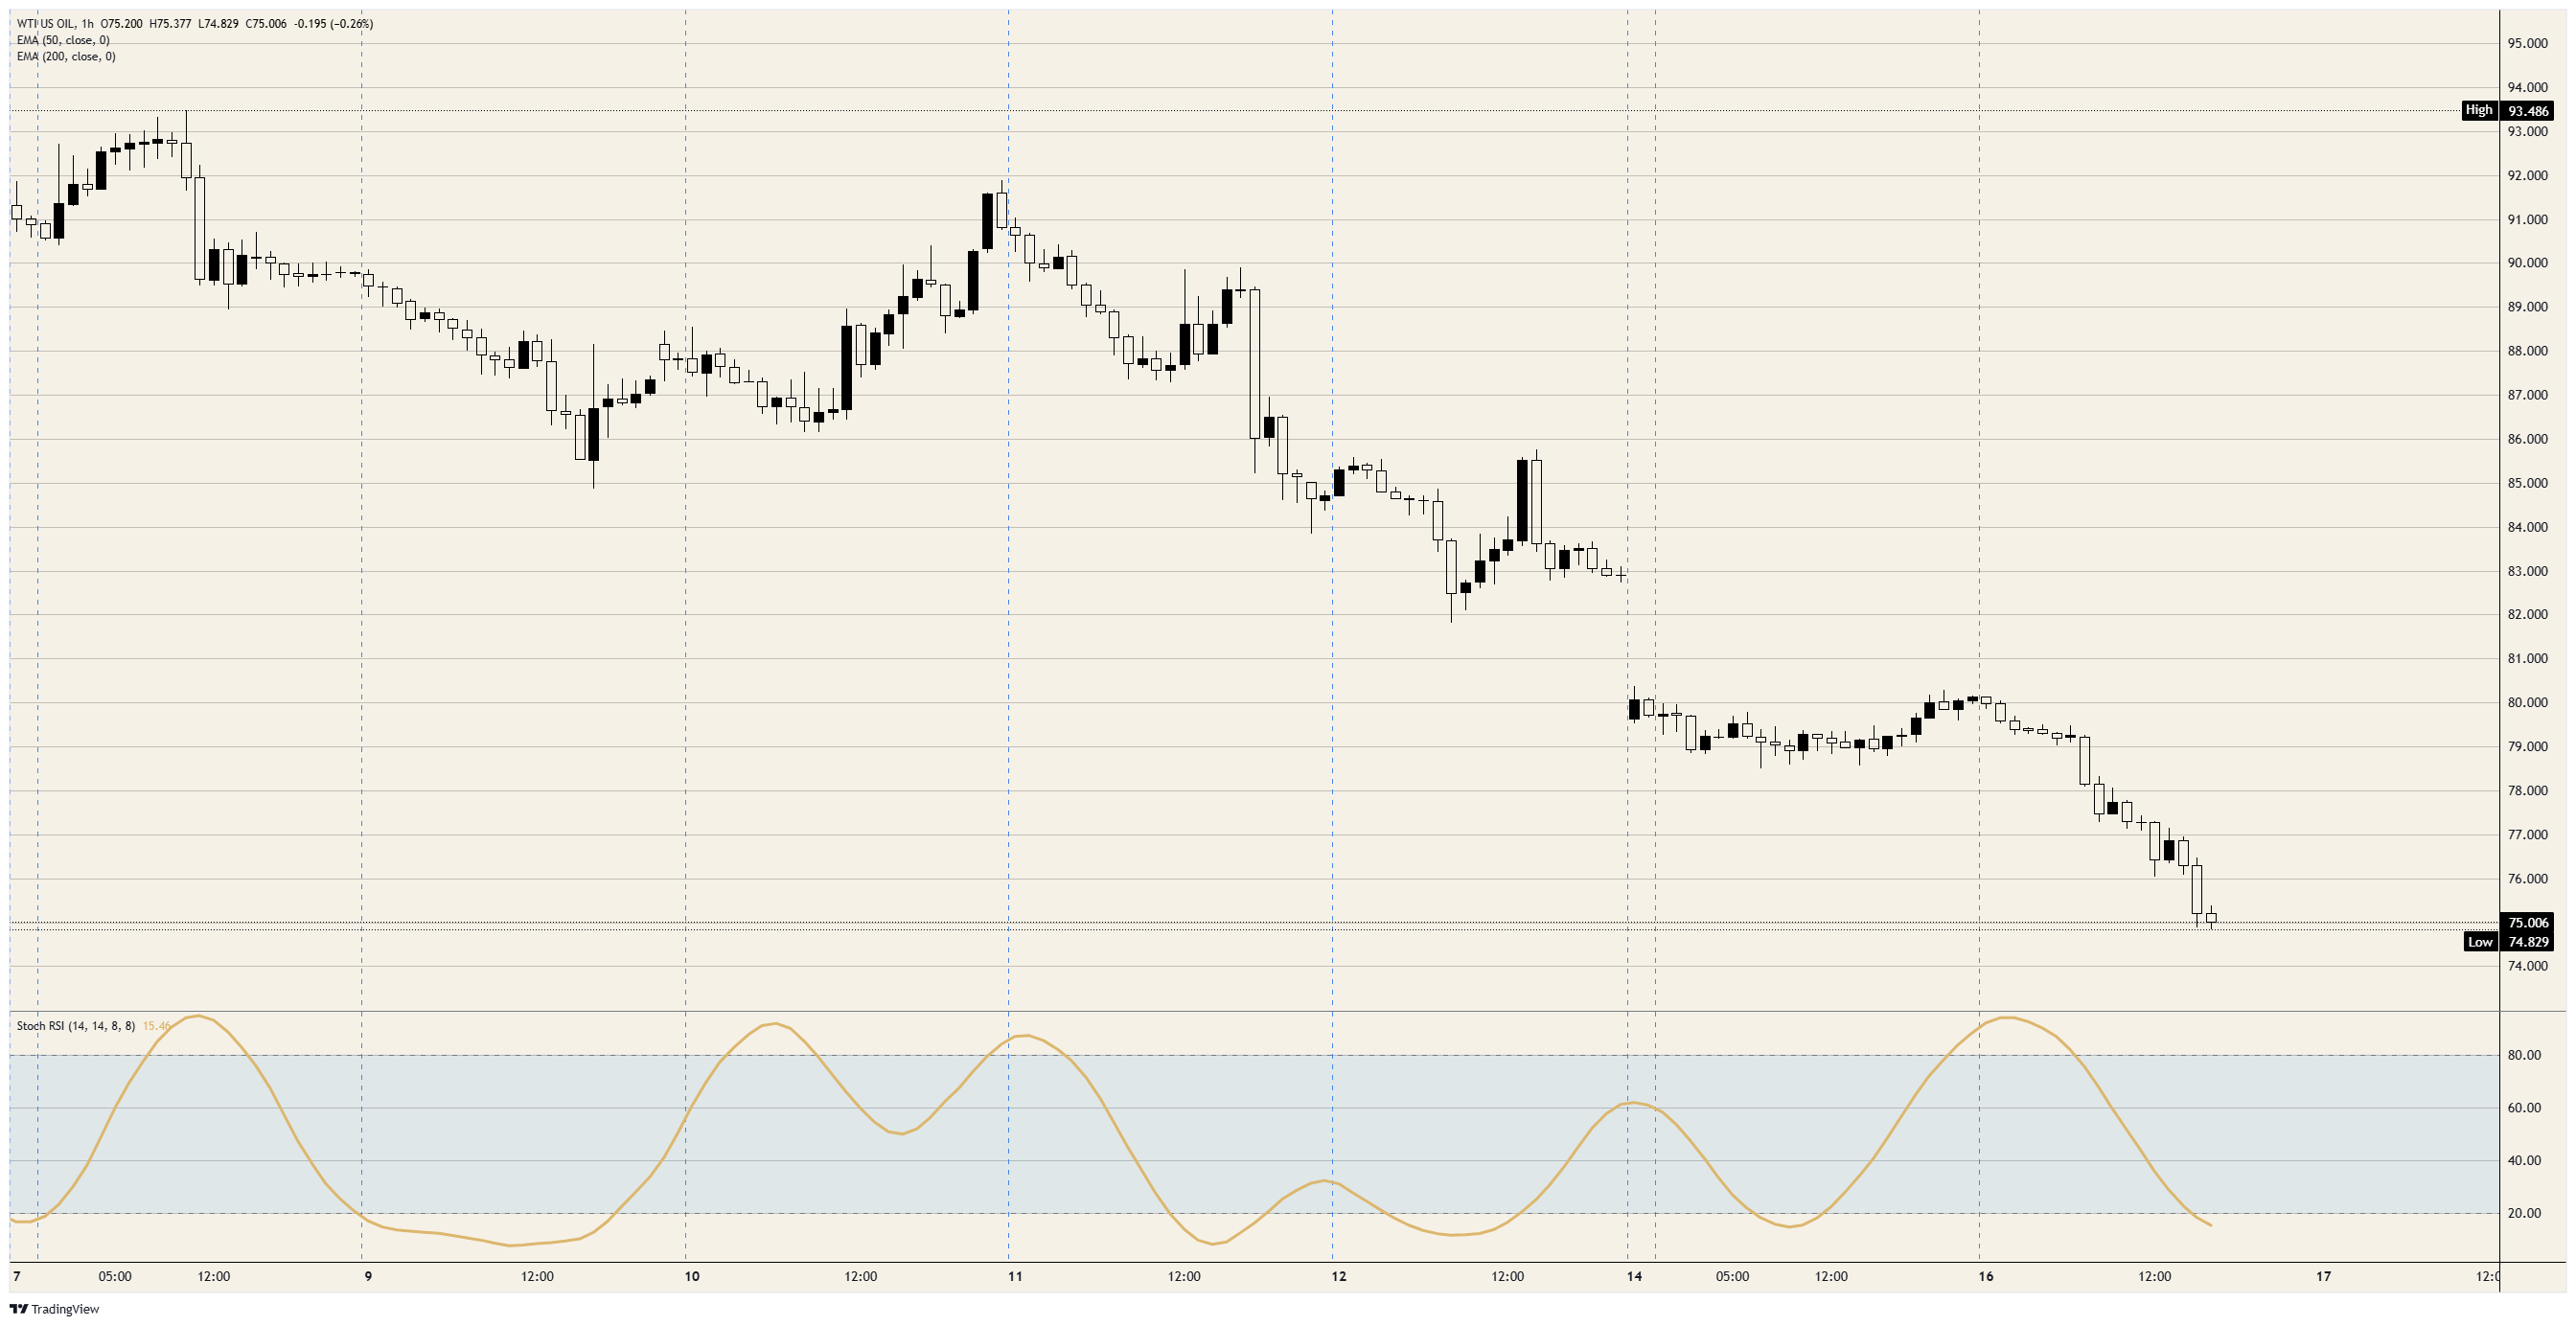
Technically, the damage is real regardless of how the politics resolve. WTI sliced through its 200-day Exponential Moving Average (EMA) near $78.50, its first decisive daily close beneath that line since hostilities began in late February, then cut through $76 on the way to probing $75. The 50-day EMA up near $90 shows how far the war premium has bled out. On the intraday chart the Stochastic Relative Strength Index (Stoch RSI) is buried near 12 and deeply oversold, yet every bounce this session has been sold, the signature of a one-way tape rather than a base. The daily Stoch RSI near 28 and still pointing lower argues the higher-timeframe move is not yet exhausted. The structural problem is that March's rally was nearly vertical, so beneath $75 little supports price until the pre-war shelf in the mid-$60s.
Wednesday stacks the Fed on top of the barrels
Before any signature, Wednesday stacks three catalysts on the tape, led by the Federal Open Market Committee (FOMC) decision at 18:00 GMT. A hold at 3.50% to 3.75% is all but locked near 97% on CME FedWatch, so the move sits in the updated projections and the first read on a Fed leadership only weeks into the job; a hawkish lean lifts the Dollar and presses Crude Oil harder, a dovish one cushions it. The weekly Energy Information Administration (EIA) inventory print at 14:30 GMT and the International Energy Agency (IEA) monthly report land earlier the same day. With balances drawing hard through the blockade, a sizeable inventory draw would hand bulls a reason to fade the deal trade, while a build would confirm the demand worry the selloff already chases.
Resistance: First reclaim is $76, with the 200-day EMA near $78.50 the level that would say the break is failing, and $80 the shelf above it.
Support: The level on the block is $75; lose it on a daily close and the path opens toward the low $70s, then a long stretch of air down to the pre-war mid-$60s.
Bias: Lower while WTI holds below $76 and its 200-day EMA, with the low $70s the near-term magnet. The single largest risk to that call is binary and lands at Friday's scheduled signing. A signed deal confirms the unwind, while a slipped or collapsed signature snaps the war premium straight back, and at these oversold readings the reversal would be fast. Trade the level, respect the headline.
WTI hourly chart
WTI Oil FAQs
WTI Oil is a type of Crude Oil sold on international markets. The WTI stands for West Texas Intermediate, one of three major types including Brent and Dubai Crude. WTI is also referred to as “light” and “sweet” because of its relatively low gravity and sulfur content respectively. It is considered a high quality Oil that is easily refined. It is sourced in the United States and distributed via the Cushing hub, which is considered “The Pipeline Crossroads of the World”. It is a benchmark for the Oil market and WTI price is frequently quoted in the media.
Like all assets, supply and demand are the key drivers of WTI Oil price. As such, global growth can be a driver of increased demand and vice versa for weak global growth. Political instability, wars, and sanctions can disrupt supply and impact prices. The decisions of OPEC, a group of major Oil-producing countries, is another key driver of price. The value of the US Dollar influences the price of WTI Crude Oil, since Oil is predominantly traded in US Dollars, thus a weaker US Dollar can make Oil more affordable and vice versa.
The weekly Oil inventory reports published by the American Petroleum Institute (API) and the Energy Information Agency (EIA) impact the price of WTI Oil. Changes in inventories reflect fluctuating supply and demand. If the data shows a drop in inventories it can indicate increased demand, pushing up Oil price. Higher inventories can reflect increased supply, pushing down prices. API’s report is published every Tuesday and EIA’s the day after. Their results are usually similar, falling within 1% of each other 75% of the time. The EIA data is considered more reliable, since it is a government agency.
OPEC (Organization of the Petroleum Exporting Countries) is a group of 12 Oil-producing nations who collectively decide production quotas for member countries at twice-yearly meetings. Their decisions often impact WTI Oil prices. When OPEC decides to lower quotas, it can tighten supply, pushing up Oil prices. When OPEC increases production, it has the opposite effect. OPEC+ refers to an expanded group that includes ten extra non-OPEC members, the most notable of which is Russia.

Lebih dari satu juta pengguna mengandalkan FXStreet untuk data pasar real-time, alat charting, wawasan ahli, dan berita forex. Kalender ekonomi komprehensif dan webinar edukatif membantu trader tetap mendapat informasi dan membuat keputusan terukur. FXStreet memiliki sekitar 60 profesional yang tersebar antara kantor pusat Barcelona dan berbagai wilayah global.
Baca Selengkapnya


