
Crypto Market Overview: Trump reassures exiting war at Easter lunch – Solana, Dash, and River extend losses
Oleh Vishal Dixit
Diperbarui: 2 Apr 2026


ARTIKEL POPULER

Bitcoin (BTC) is trading below $68,000 at press time on Thursday, extending losses to roughly 2% amid US President Donald Trump’s reaffirmation of the hopes of de-escalation in the Middle East at Wednesday’s Easter lunch at the White House.
- Bitcoin extends losses below $68,000 on Thursday, risking the 4% recovery from earlier this week.
- Donald Trump’s Easter lunch softens pressure on Oil prices amid hopes of de-escalation in the Middle East this month.
- Solana, Dash, and River extend losses over the last 24 hours, risking further correction.
Bitcoin (BTC) is trading below $68,000 at press time on Thursday, extending losses to roughly 2% amid US President Donald Trump’s reaffirmation of the hopes of de-escalation in the Middle East at Wednesday’s Easter lunch at the White House. This reassurance momentarily capped Oil prices below $100, which rose back to $104 during early Asian hours on Thursday. Meanwhile, the altcoins are trading under pressure as sentiment falters, with Solana (SOL), Dash (DASH), and River (RIVER) posting losses over the last 24 hours.
Donald Trump’s Easter lunch
US President Donald Trump, at the Easter lunch at the White House on Wednesday, reaffirmed the possibility of US forces exiting the war with Iran in two or three weeks. Trump also said that Iran’s capability to launch missiles and drones has been curtailed, and the US doesn't need oil from the Middle East, as previously reported by FXStreet. This leaves the question of the reopening of the Strait of Hormuz unanswered.
Bearish bets resurface in the crypto market
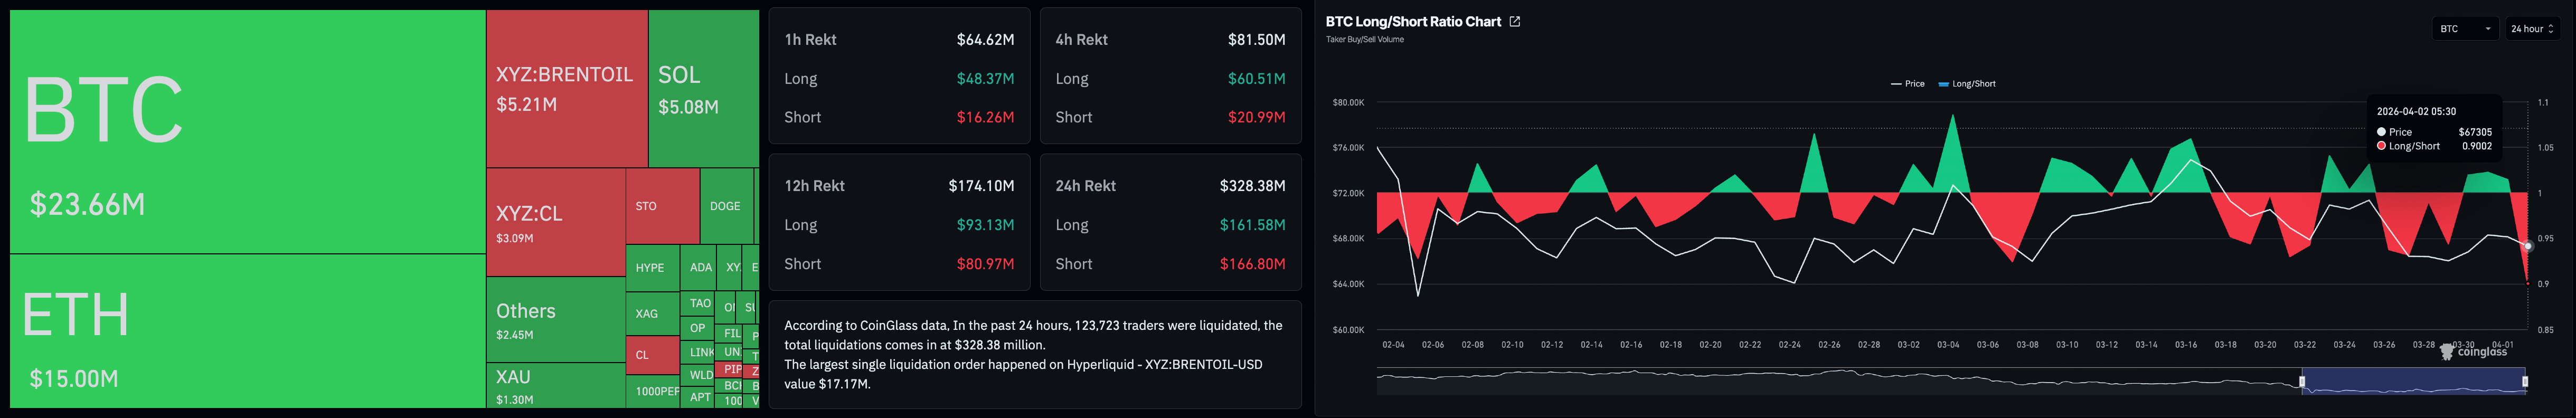
Bitcoin hovers slightly above $67,000 on Thursday as the broader market continues to face persistent downside pressure. CoinGlass data shows the long-to-short ratio in Bitcoin derivatives has dropped to 0.9002, indicating a greater number of short positions. This sell-side dominance aligns with the liquidations reaching $328 million over the last 24 hours, led by $60 million in long liquidations over the last 4 hours.
Technical outlook: Solana, Dash and River at risk of further correction
Solana trades below $80 at press time on Thursday, down roughly 3% intraday. The near-term bias turns bearish as SOL extends its rejection well below the 50-day Exponential Moving Average (EMA), which is clustered far beneath the 200-day EMA, underscoring a weakened structure within a broader downtrend.
The path of least resistance targets the February 24 low at $75.63, followed by the February 6 low at $67.50.
The Moving Average Convergence Divergence (MACD) indicator slips further below its signal line into negative territory, with an expanding negative histogram suggesting building downside momentum. The Relative Strength Index (RSI) near 37 indicates momentum is firmly below the midline, without yet entering oversold territory, leaving room for additional pressure.
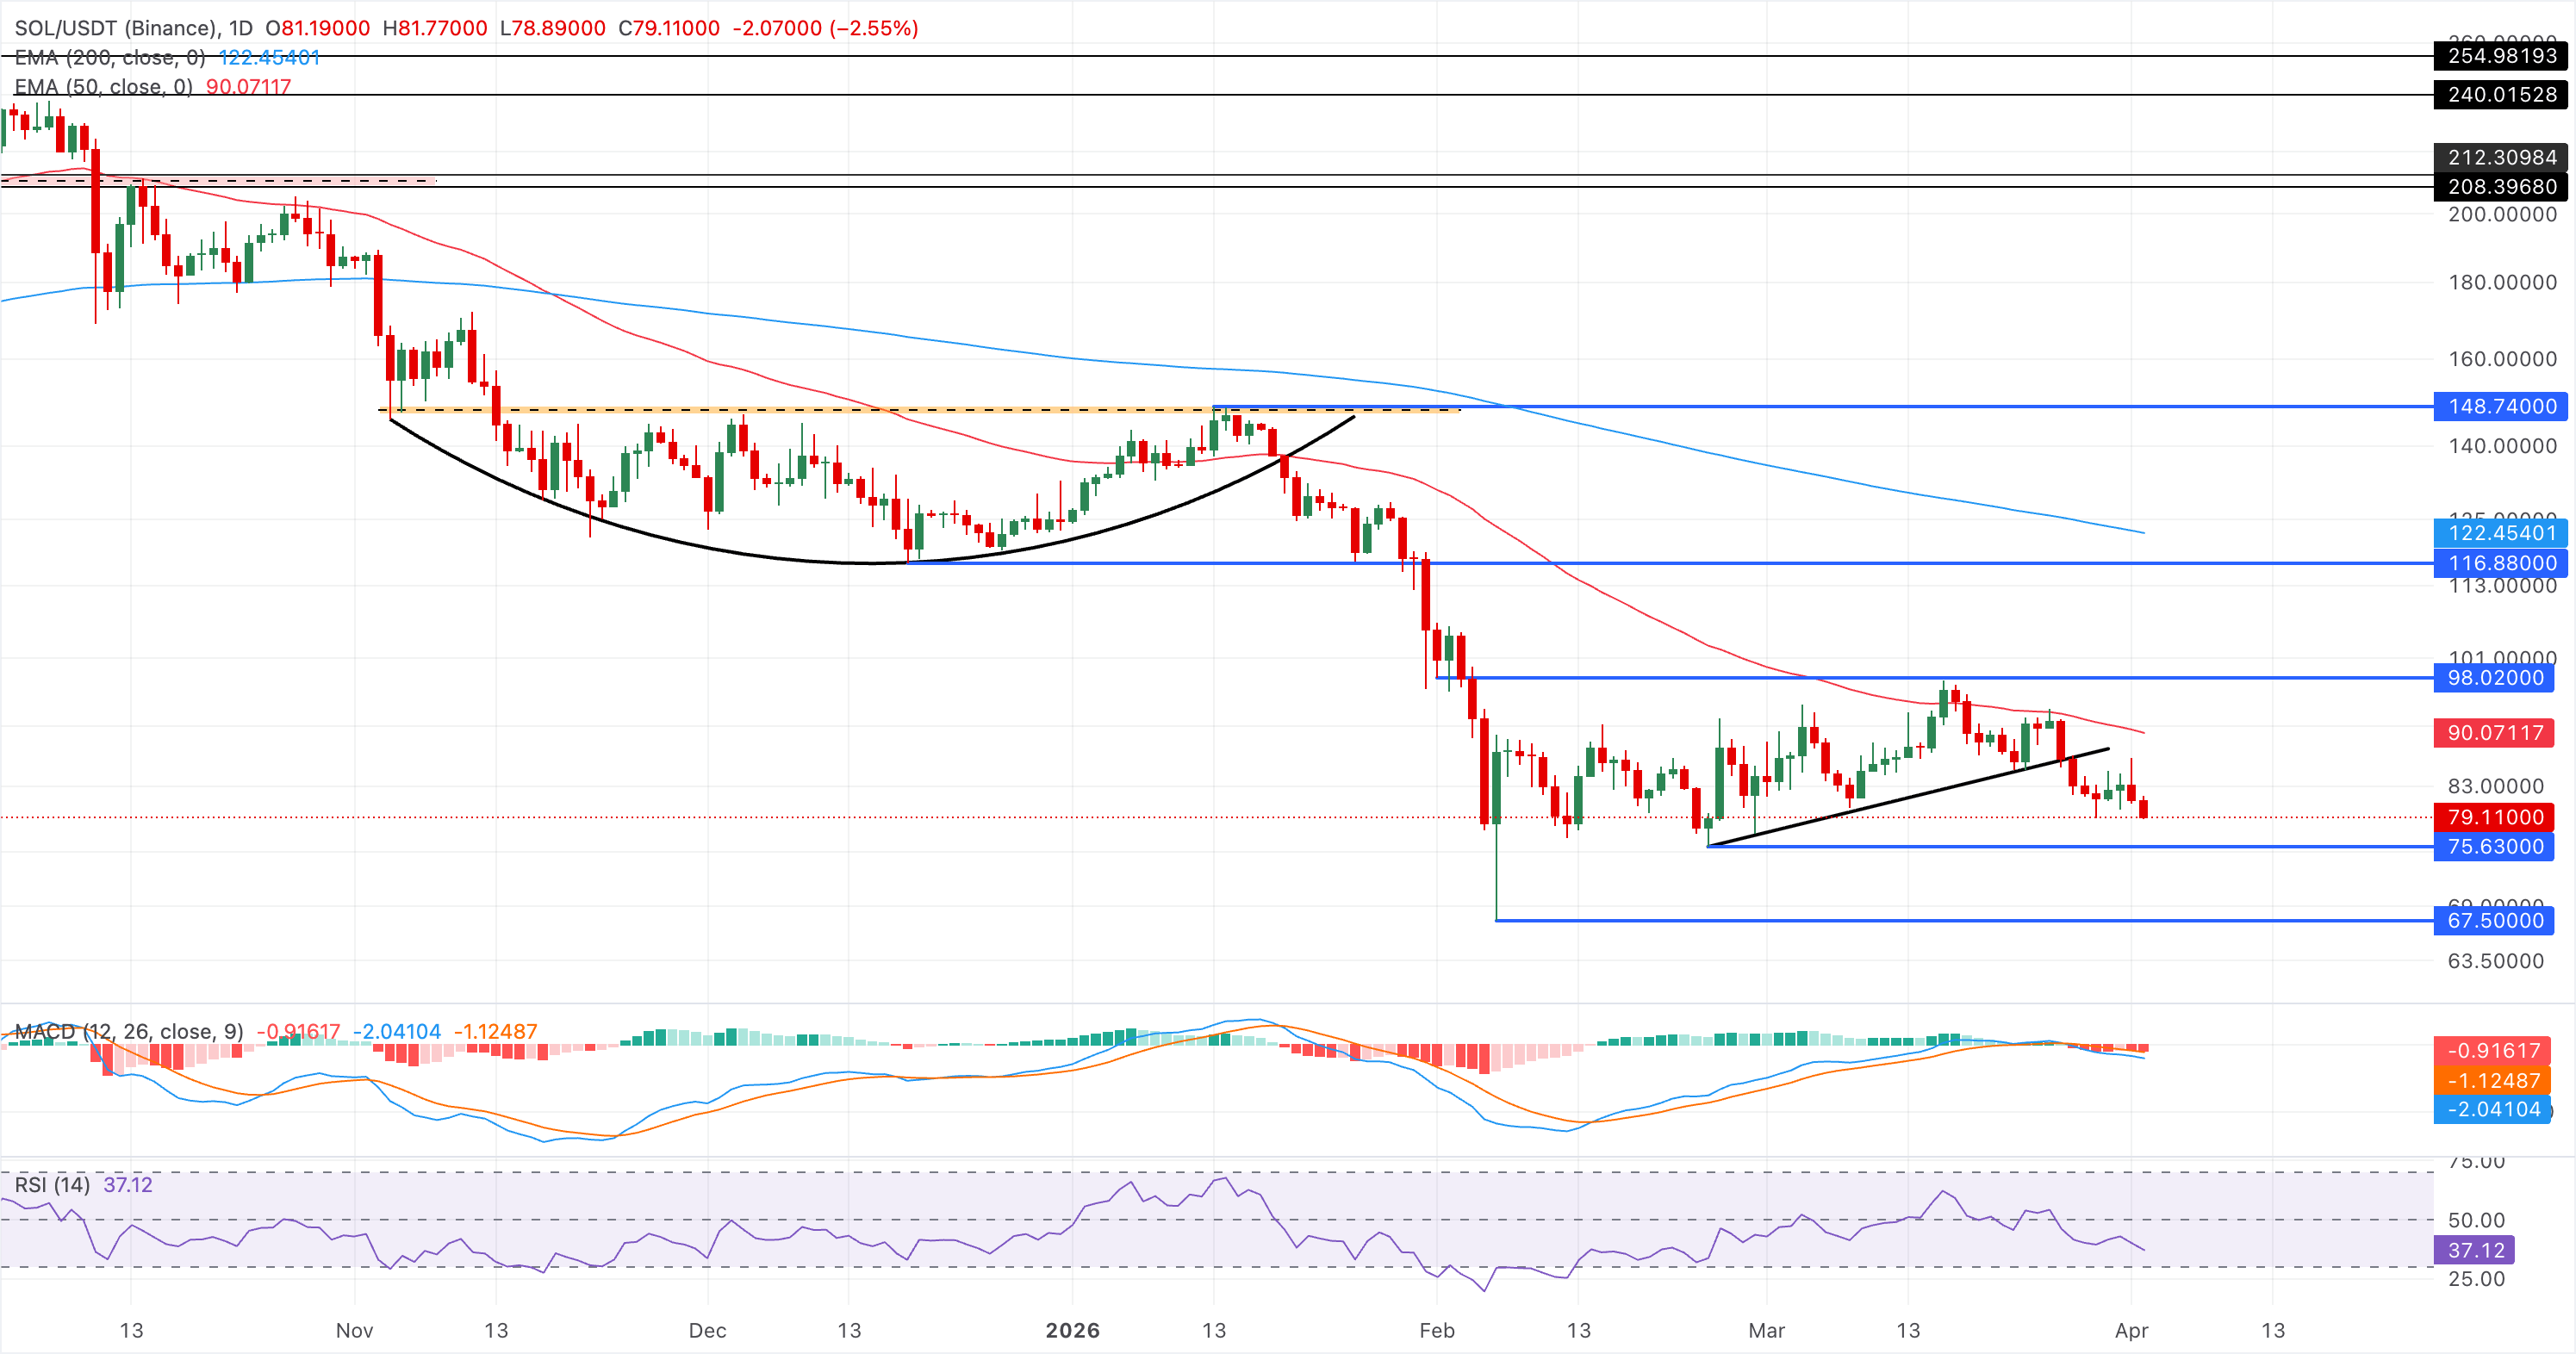
Looking up, the 50-day EMA at $90.08 remains the key resistance capping the near-term recoveries.
Dash trades around $30 at the time of writing on Thursday. The near-term bias is bearish as DASH extends below the clustered 50-, 100-, and 200-day EMAs, keeping DASH entrenched in a mature downtrend.
The descending resistance trend line from $41.55 continues to cap the upside, with the latest failure below the break area around $34.40 reinforcing supply overhead. A decisive close above this level would confirm a renewed buy-side dominance, targeting the R1 Pivot Point at $36.48.
Momentum gauges echo the weak tone: the MACD line has slipped below its signal line and turned negative, while the histogram has expanded on the downside, suggesting strengthening bearish pressure. The RSI at 41 leans below the midline, indicating sellers retain control despite the absence of oversold conditions.
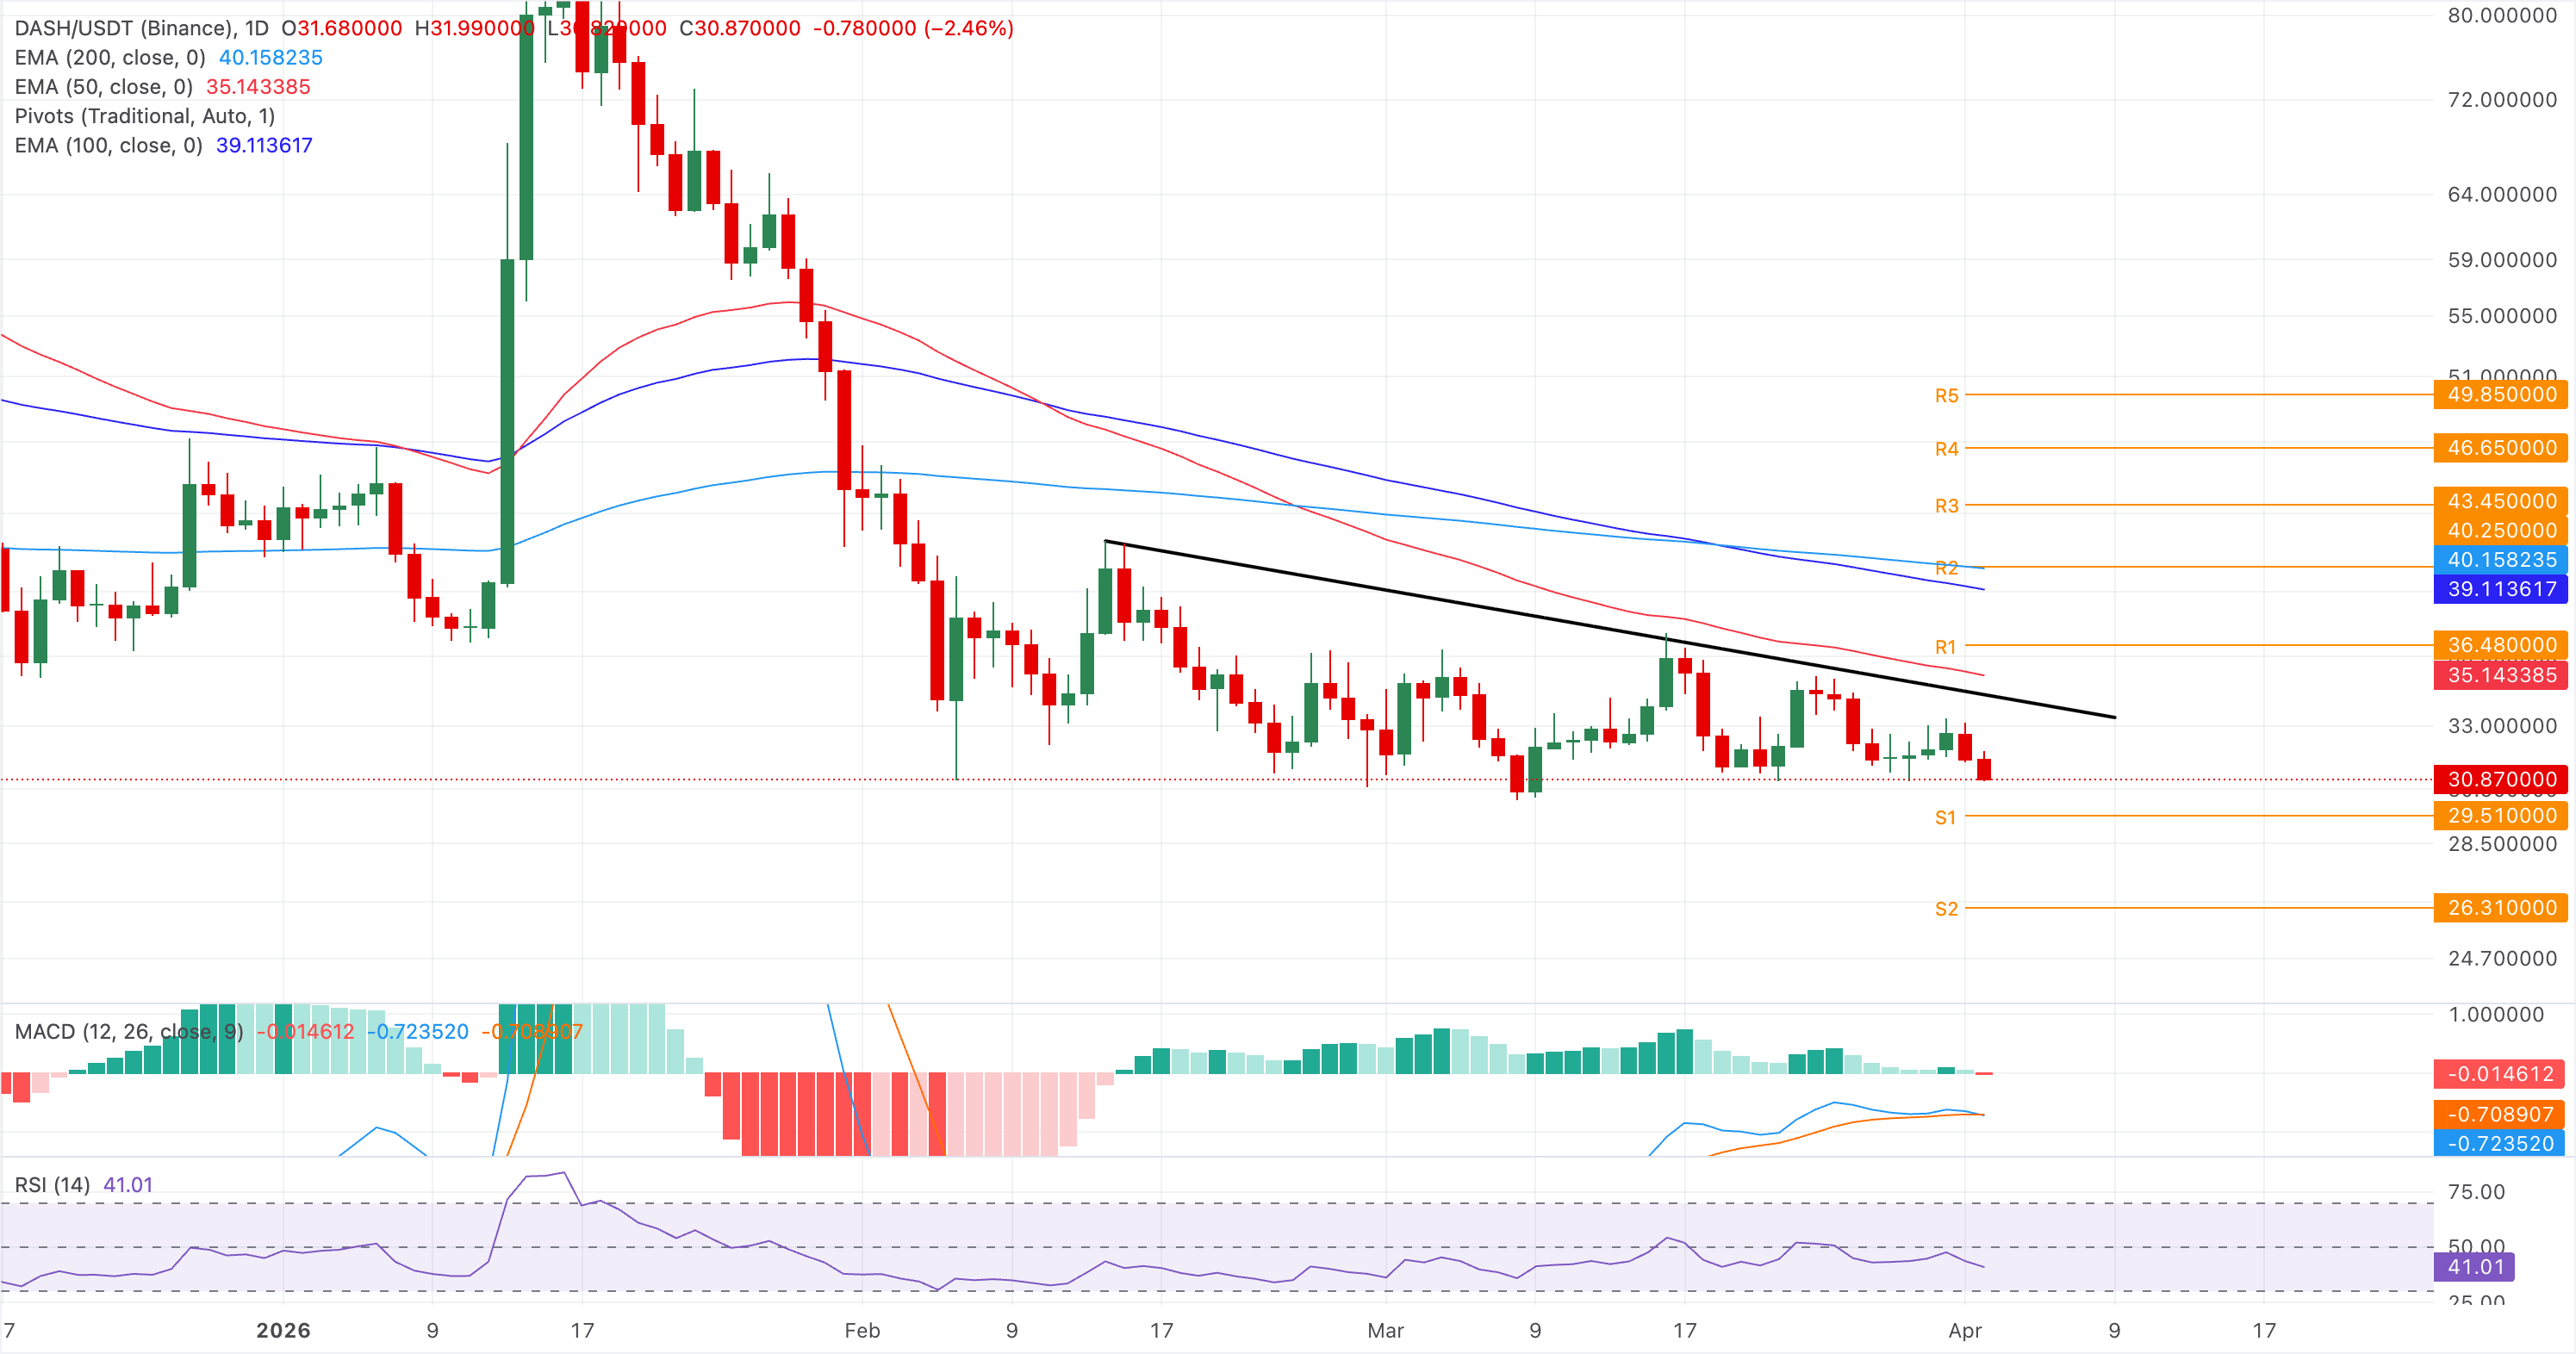
Looking down, the crucial support for Dash lies at the S1 and S2 Pivot Points at $29.51 and $26.31, respectively.
River is trading below the 50- and 100-day EMAs, around $15 at the time of writing on Thursday. The 23.6% Fibonacci retracement level of the $87.60 to $7.26 decline at $13.07 serves as the immediate support for RIVER.
The MACD line holds below its signal line, and both run above the zero line, suggesting corrective downside within a broader positive backdrop, while the negative histogram bars narrow and point to fading selling pressure. The RSI at 44 remains below the 50 midline, reinforcing a soft bias rather than a momentum collapse.
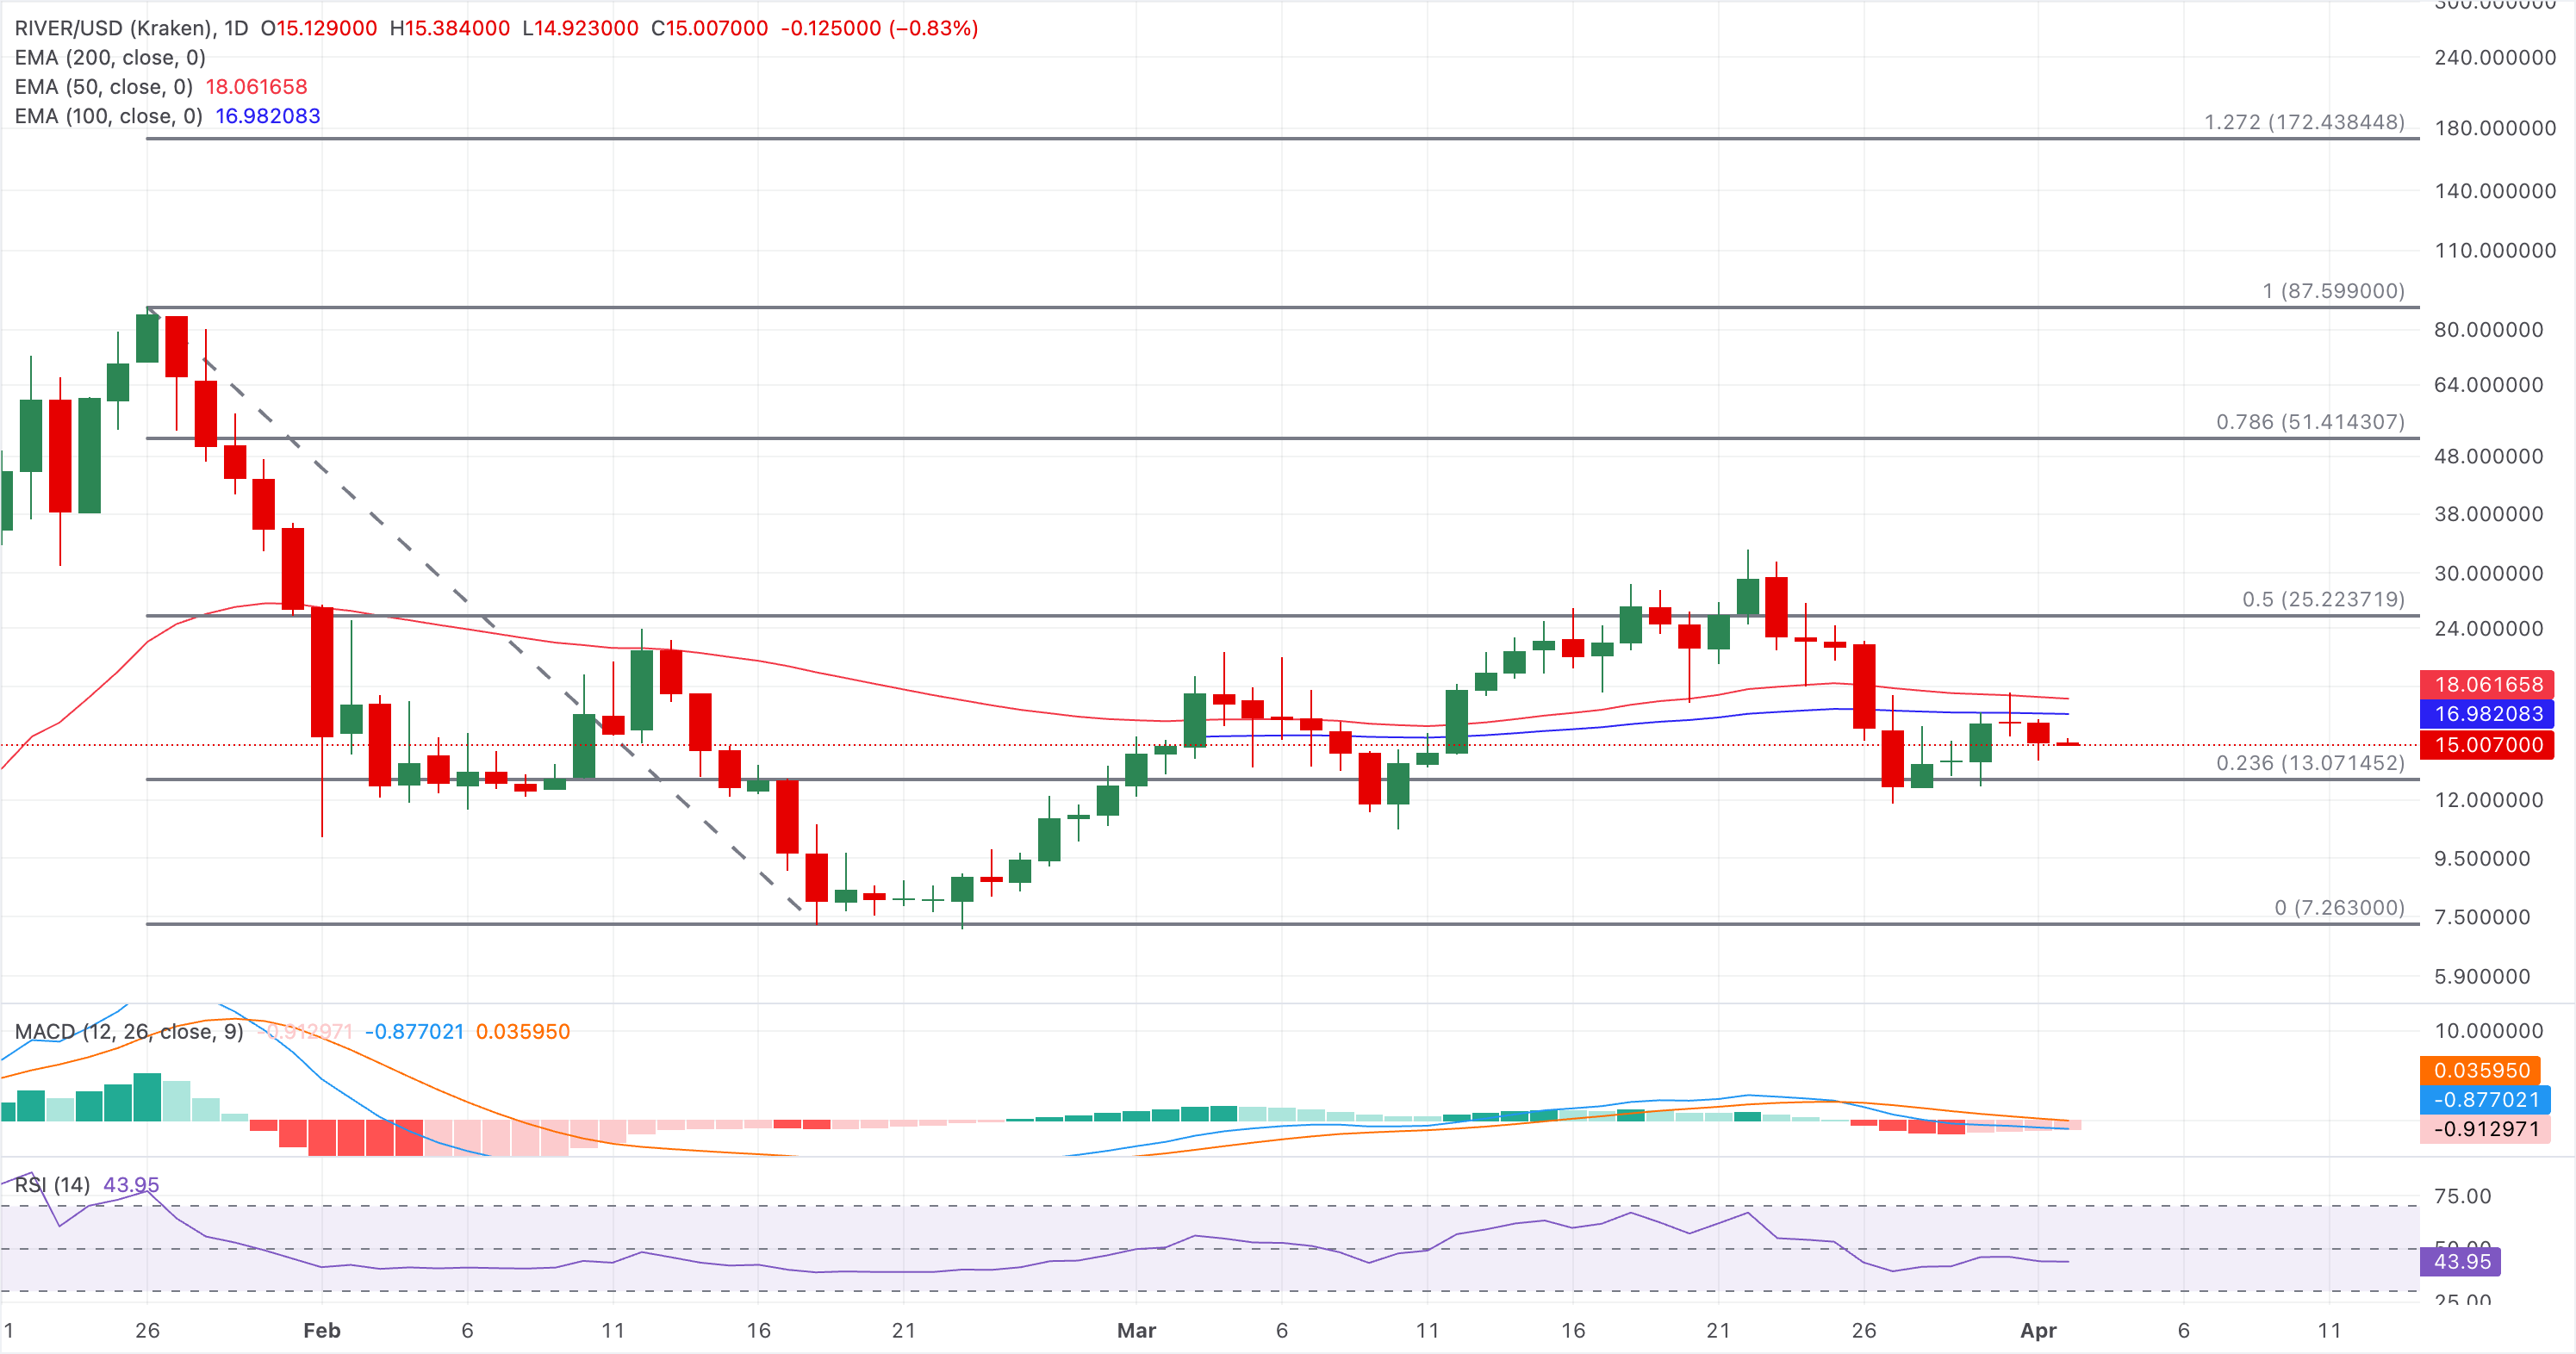
Initial resistance at the descending 50-day EMA at $18.06 followed by the 100-day EMA at $16.98 would be the first signal that buyers are regaining control and could open the way toward the 50% retracement level at $25.22.
(The technical analysis of this story was written with the help of an AI tool.)

Lebih dari satu juta pengguna mengandalkan FXStreet untuk data pasar real-time, alat charting, wawasan ahli, dan berita forex. Kalender ekonomi komprehensif dan webinar edukatif membantu trader tetap mendapat informasi dan membuat keputusan terukur. FXStreet memiliki sekitar 60 profesional yang tersebar antara kantor pusat Barcelona dan berbagai wilayah global.
Baca Selengkapnya


