
Crypto Today: Bitcoin, Ethereum and XRP steady after sentiment-driven sell-off, ETF outflows
Oleh John Isige
Tanggal Diterbitkan: 20 Mar 2026 | Tanggal Dimodifikasi: 20 Mar 2026


ARTIKEL POPULER

Cryptocurrency prices are generally rising on Friday, following a sudden, widespread pullback the previous day that reflected risk-off sentiment related to the Middle East war and the Federal Reserve’s (Fed) hawkish stance on interest rate cuts in 2026.
- Bitcoin recovers above $71,000 on Friday despite cooling institutional and retail interest.
- Ethereum remains within a potential buy zone, seeking support at the upper boundary of the previous range.
- XRP rebounds but holds below the 50-day EMA amid narrowing retail demand and muted ETF activity.
Cryptocurrency prices are generally rising on Friday, following a sudden, widespread pullback the previous day that reflected risk-off sentiment related to the Middle East war and the Federal Reserve’s (Fed) hawkish stance on interest rate cuts in 2026.
Bitcoin (BTC) has returned above $71,000 from lows clustered around $68,795, while Ethereum (ETH) hovers above $2,100. Meanwhile, Ripple (XRP) is gaining traction above $1.45, with its upside capped by initial resistance at $1.50.
Institutional and retail demand fade
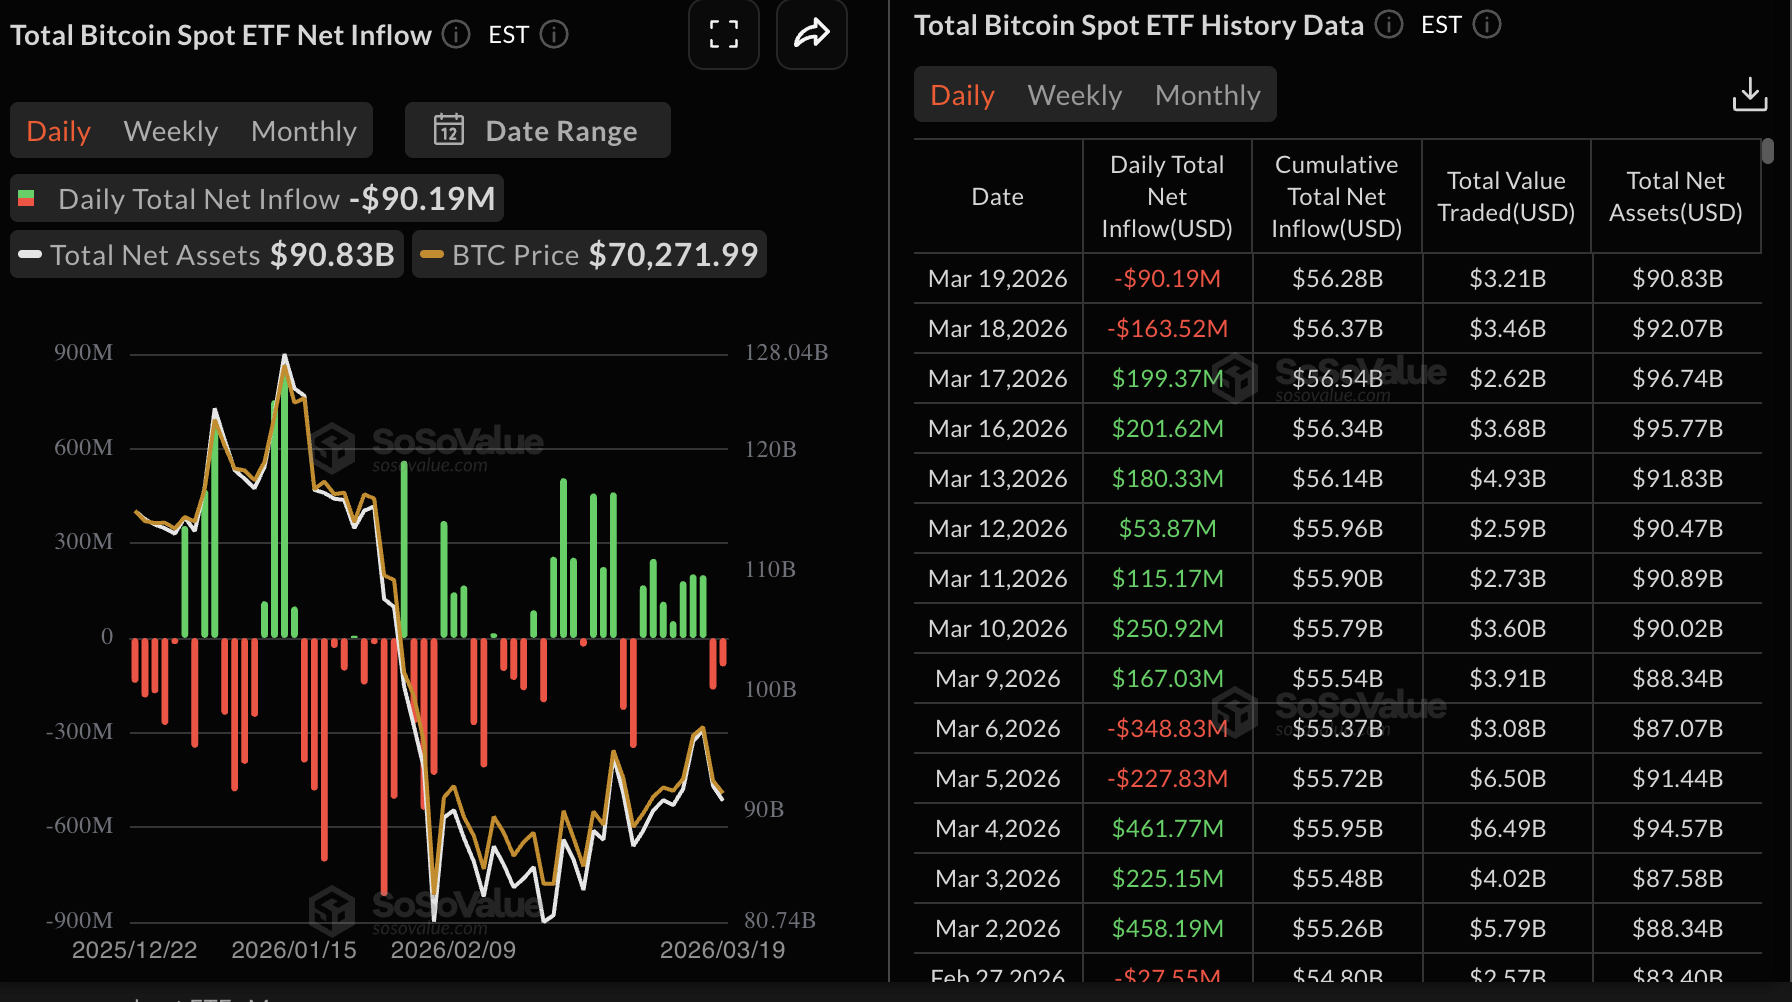
Interest in Bitcoin generally cooled mid-week after spot BTC Exchange-Traded Funds (ETFs) broke seven days of consecutive inflows. As reported, US-listed ETFs experienced $163 million in outflows on Wednesday, and the streak extended to Thursday, with investors withdrawing approximately $90 million.
The outflows mirrored risk-off sentiment related to the Middle East war, as the United States (US) and Israel escalated attacks on Iran. The Iranian regime responded with attacks on Qatar’s largest liquefied natural gas (LNG) facility amid the Oil chokepoint in the Strait of Hormuz.
Global markets remain on edge as Oil and energy prices skyrocket, signaling potential lasting effects on many economies.
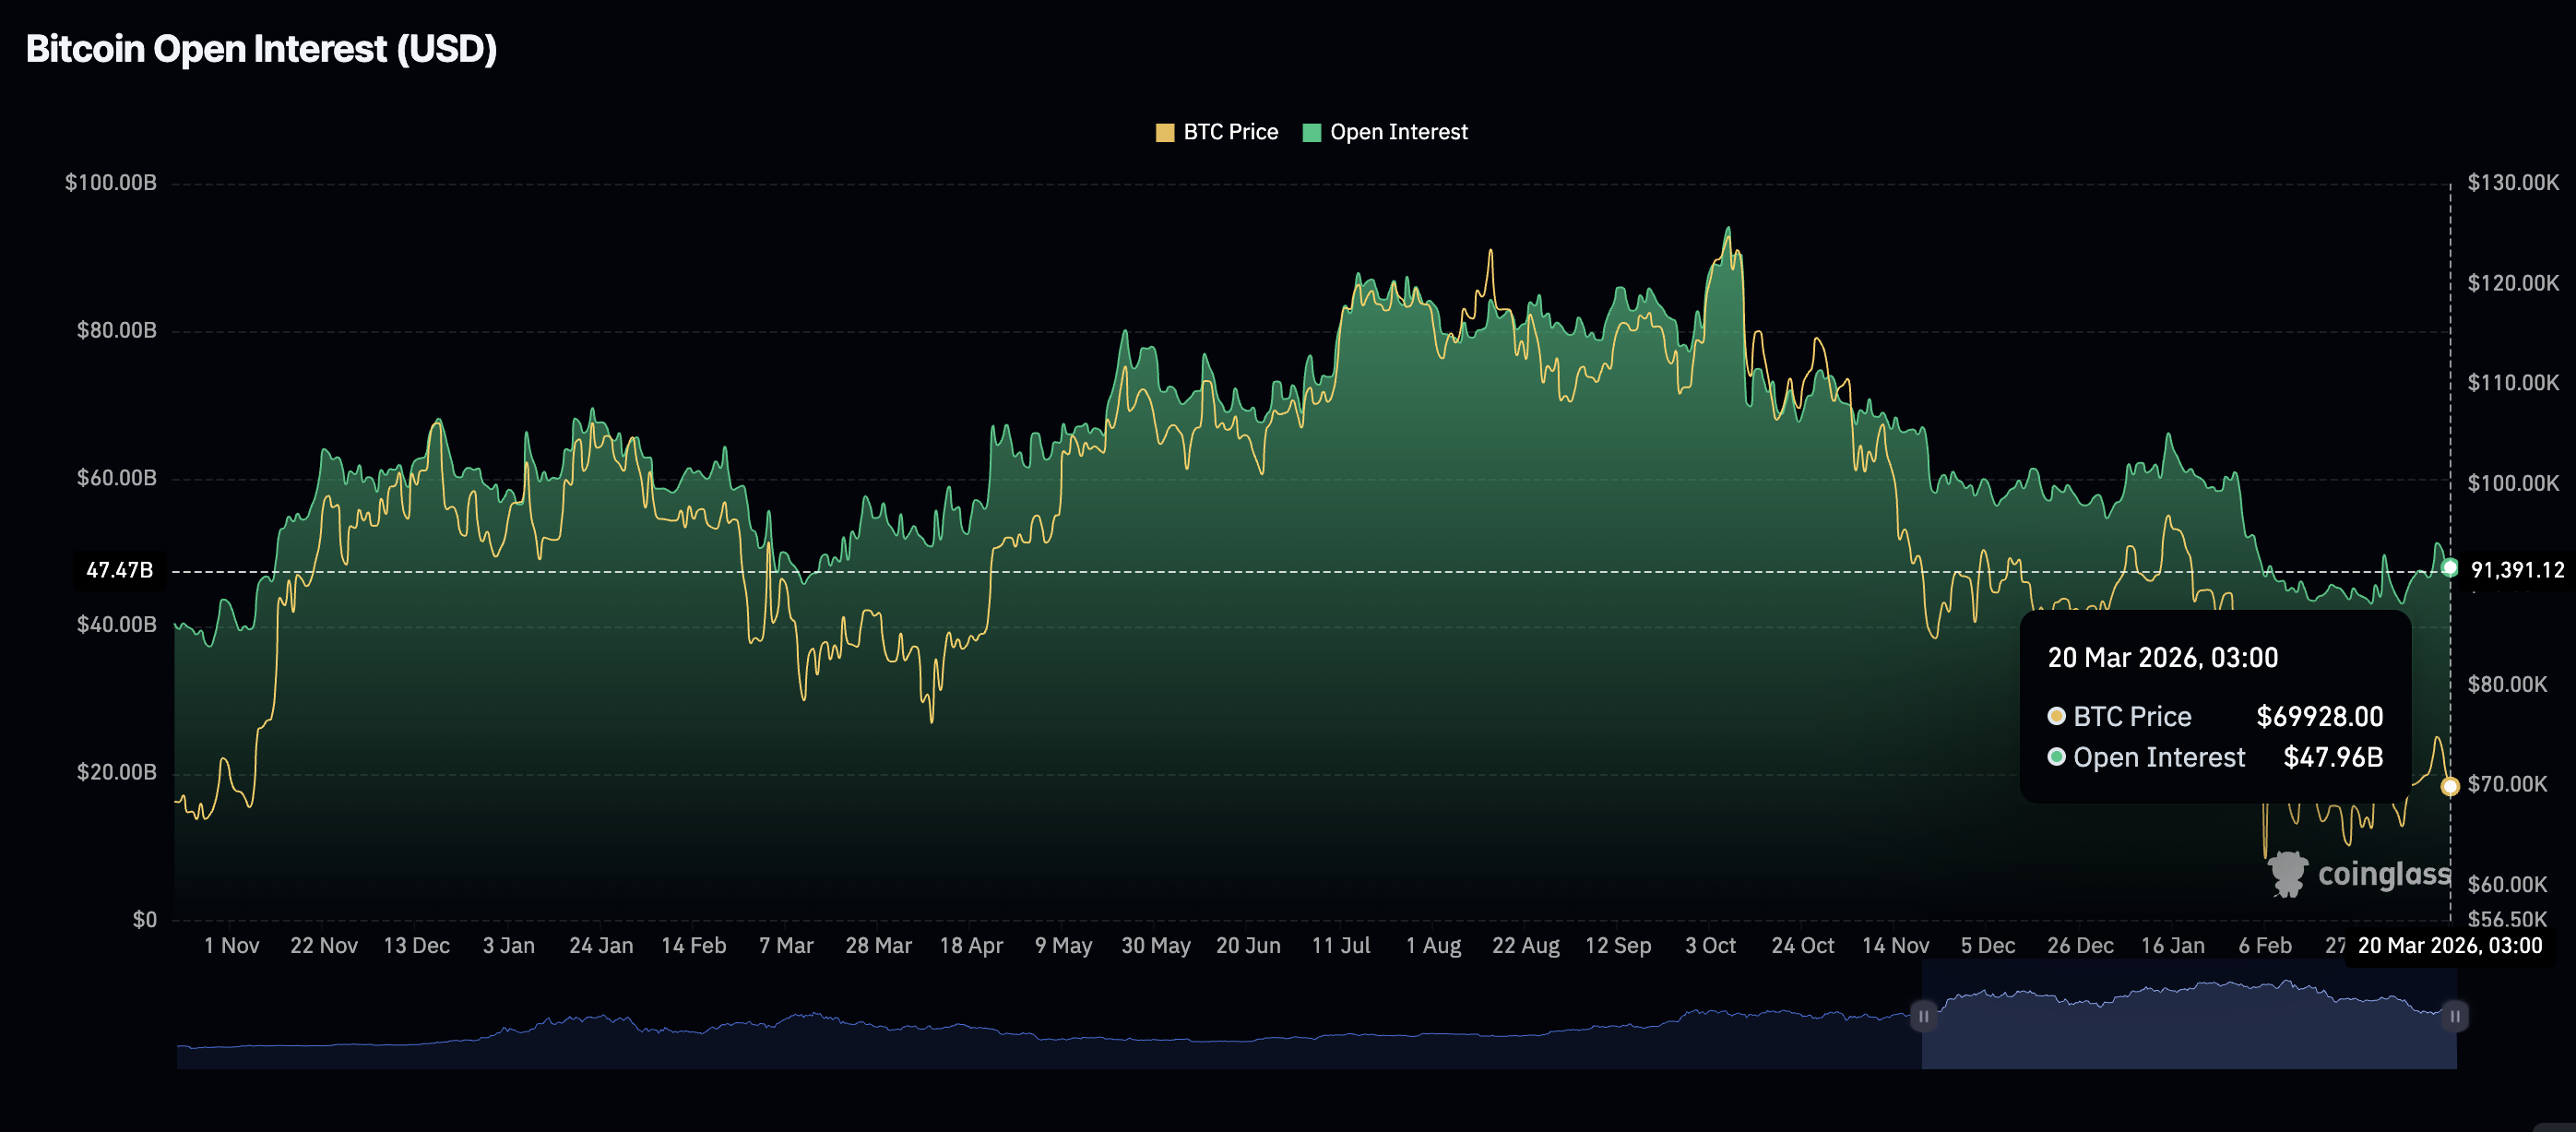
Retail investors slowed their derivatives purchases, causing a negative shift in Bitcoin futures Open Interest (OI) to $47.96 billion on Friday, from $48.53 billion the previous day. If the decline persists, overhead pressure could increase, thereby limiting Bitcoin’s upside potential.
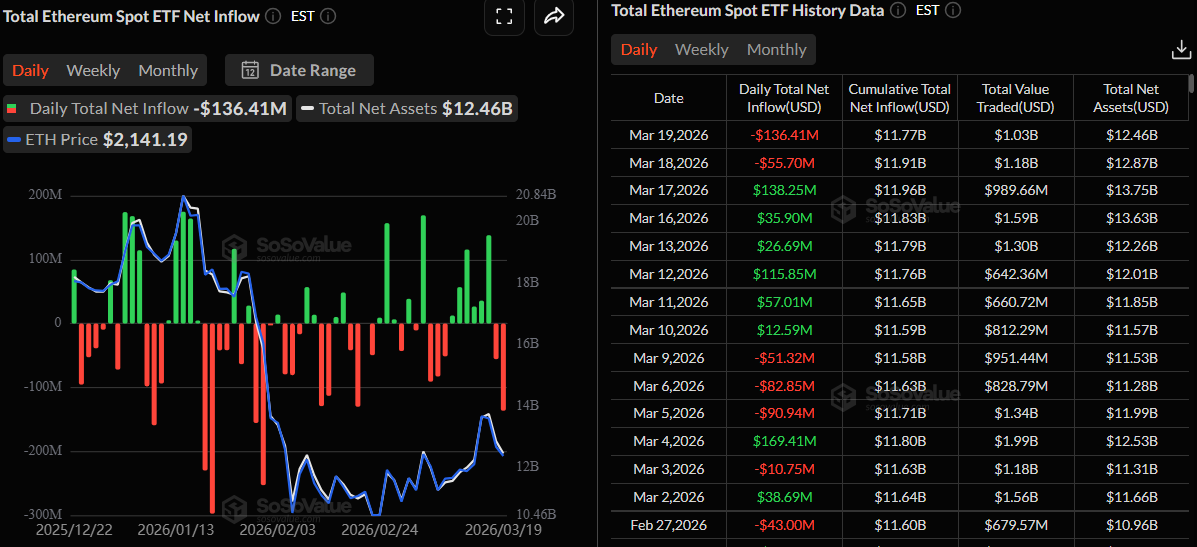
Ethereum similarly extended outflows for the second consecutive day, with investors withdrawing $136 million from spot ETFs on Thursday, up from $56 million outflows the previous day. Cumulative inflows stand at $11.78 billion, and net assets under management at $12.47 billion.
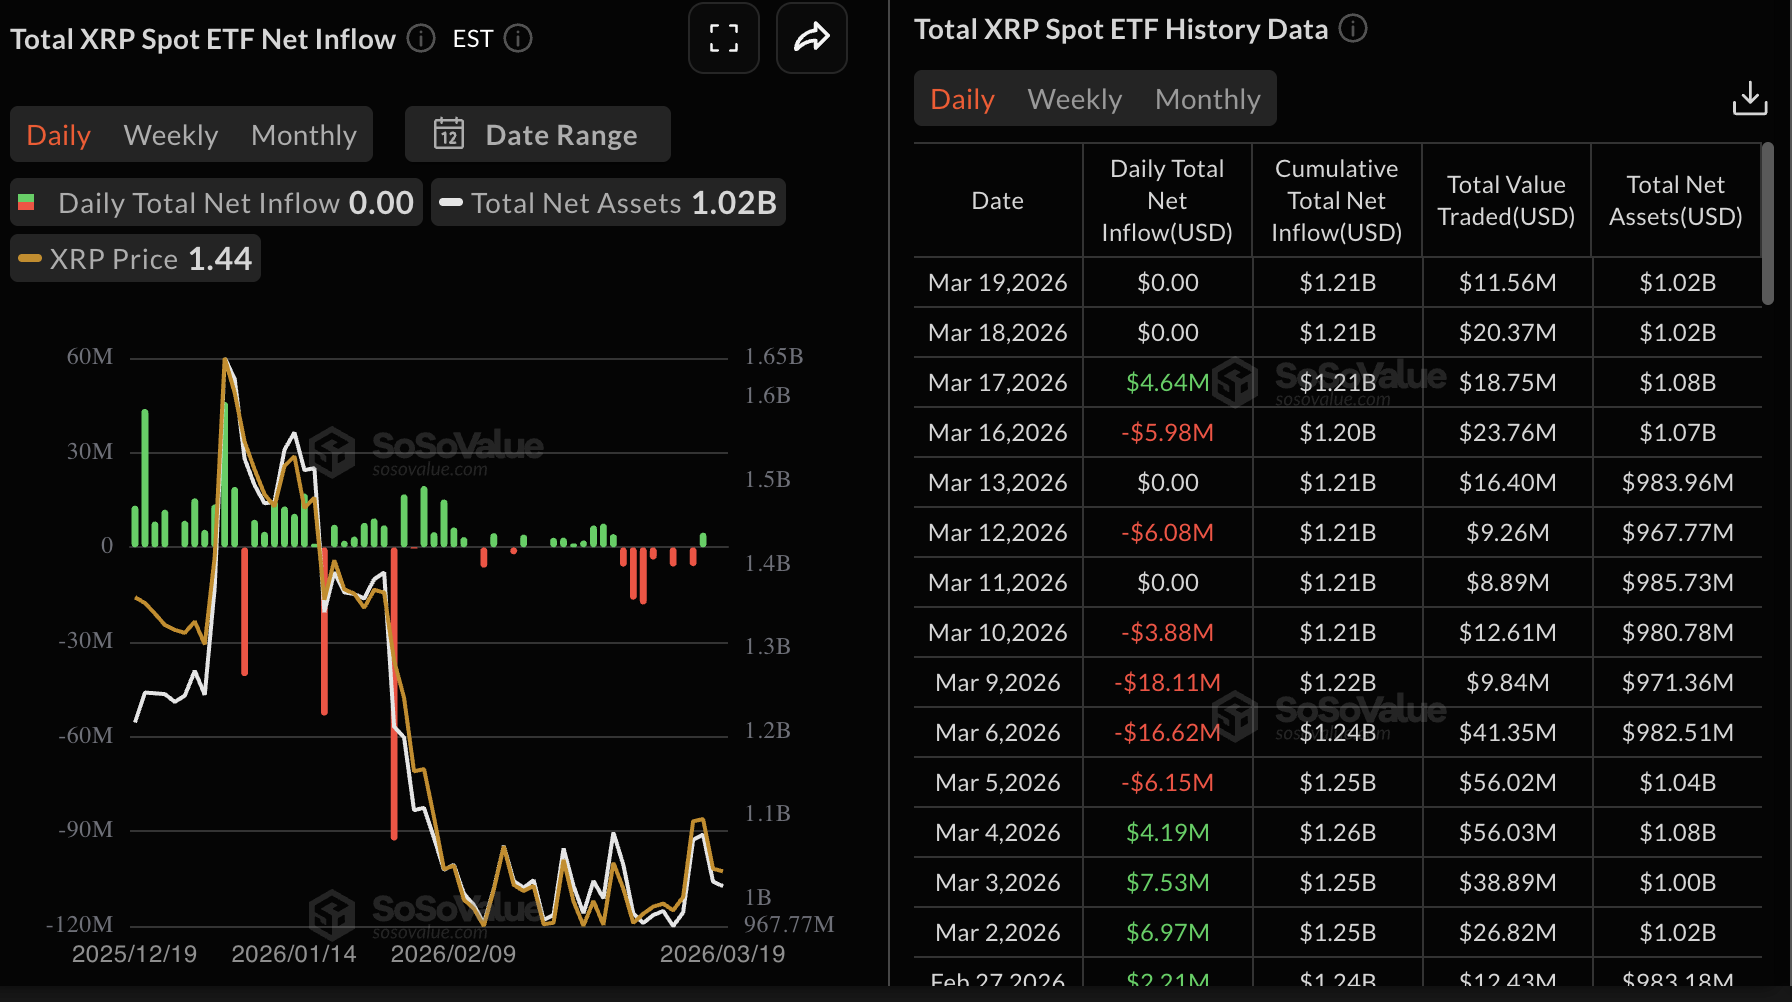
Meanwhile, activity in XRP spot ETFs remained muted on Thursday and Wednesday, with zero flows recorded, according to SoSoValue data. Cumulative inflows hold at $1.21 billion with net assets under management averaging $1.02 billion. Muted activity undermines institutional interest in XRP, potentially weakening sentiment and delaying price recovery.
The XRP derivatives market is facing a slump in retail interest, as futures OI, which reflects the notional value of outstanding futures contracts, shrinks to $2.56 billion on Friday, from $2.67 billion the previous day.
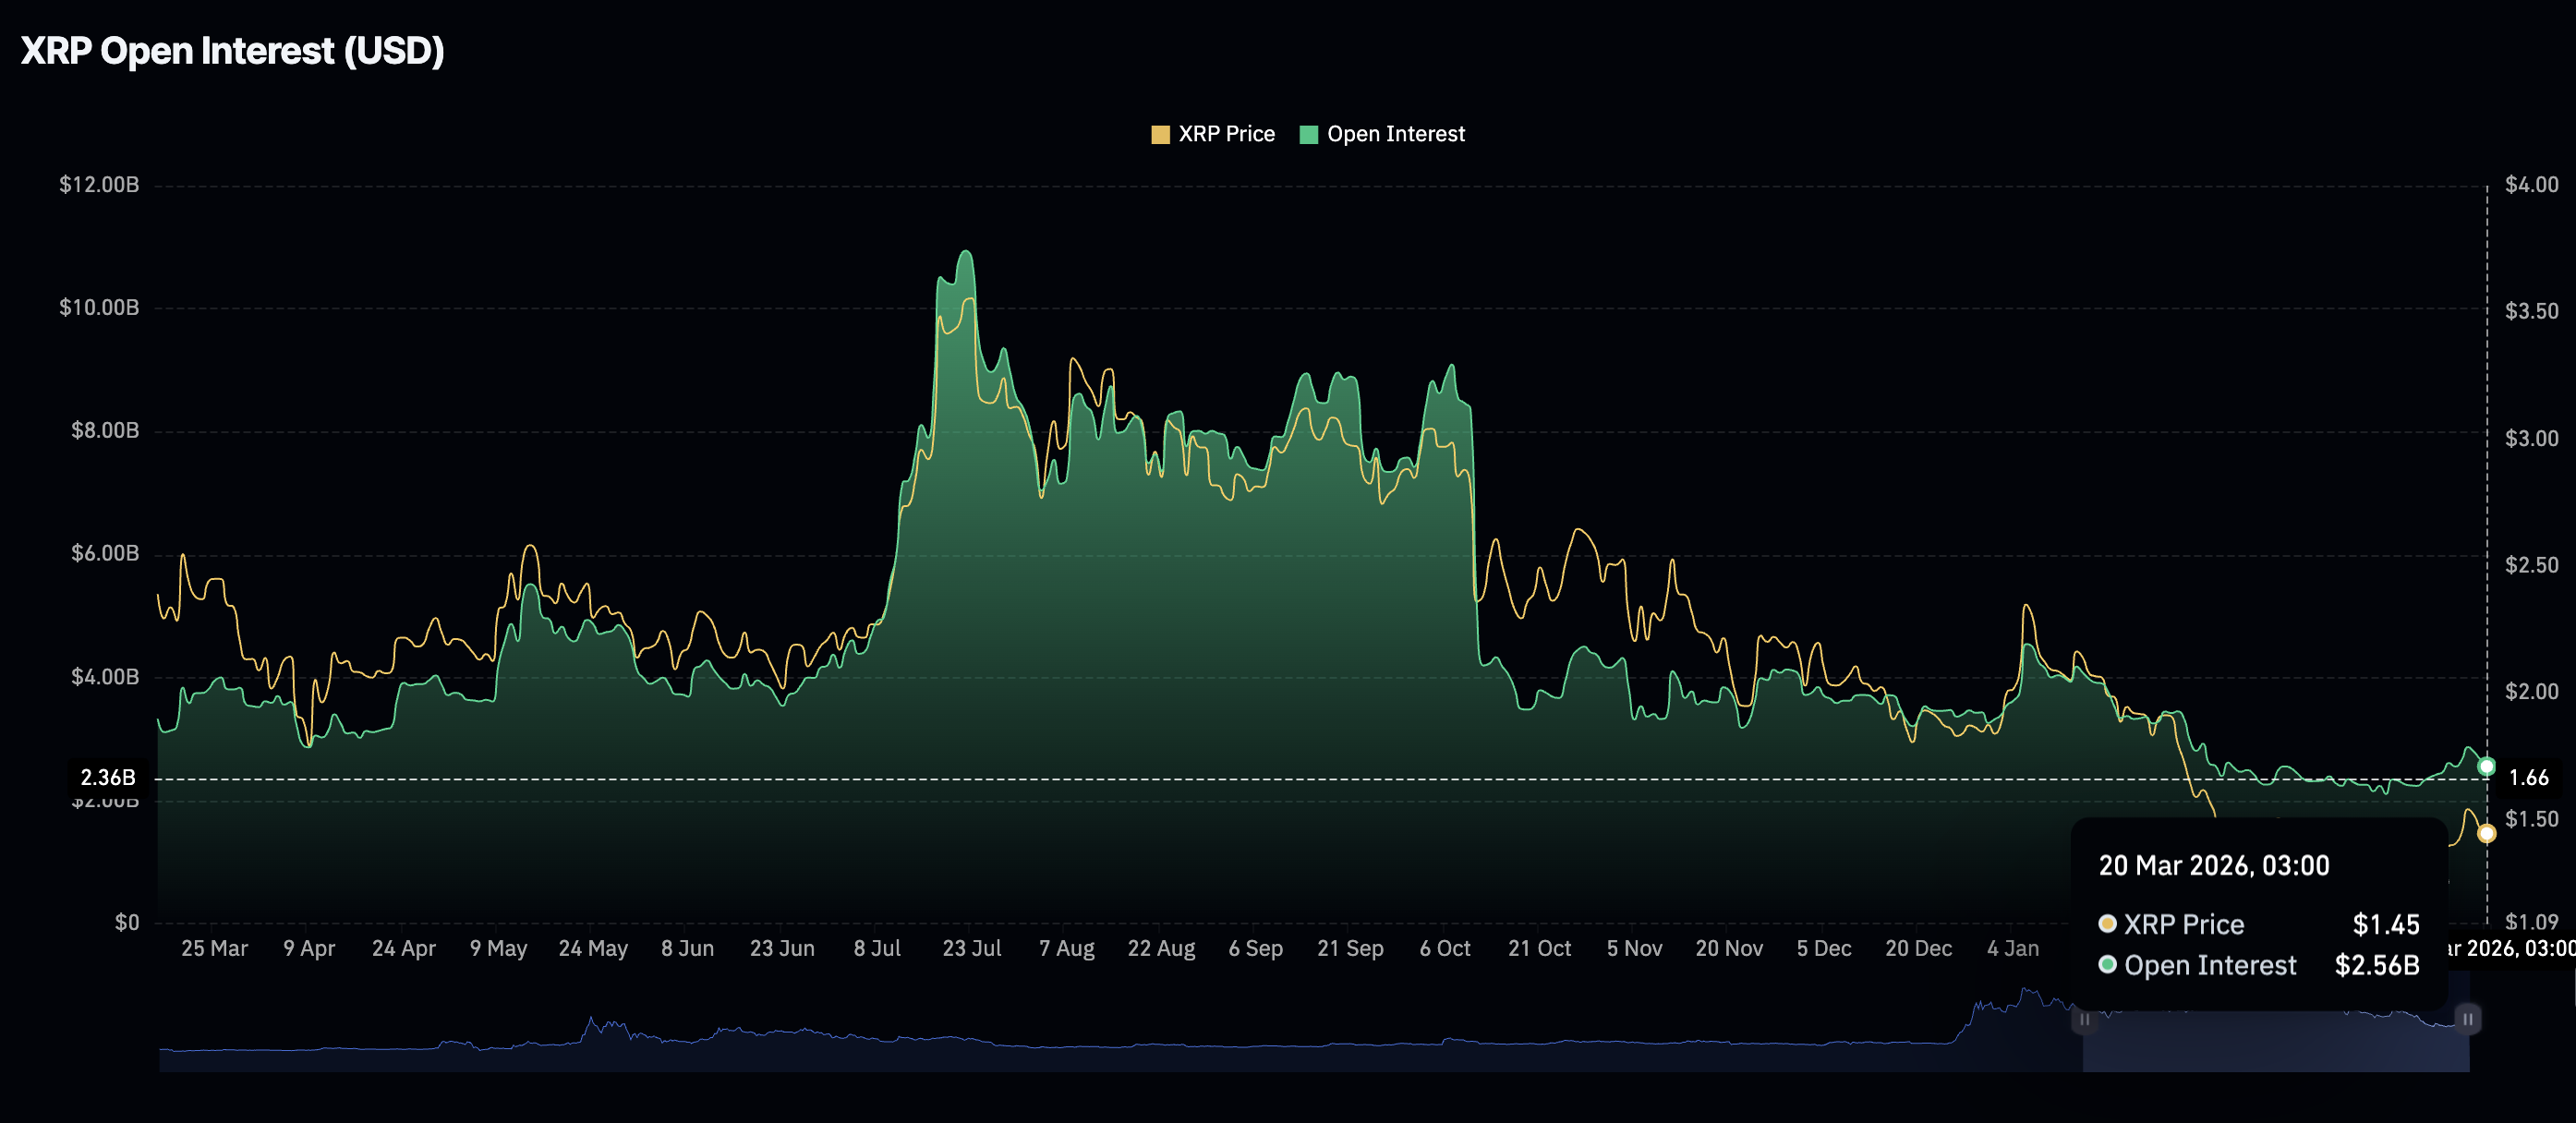
Chart of the day: Bitcoin attempts recovery
Bitcoin is edging higher above $71,000, as its near-term bias stays cautiously bullish. Despite the recovery from Thursday's low of $68,795, the price remains below the 50-day Exponential Moving Average (EMA), which appears to cap rebounds at $72,684. Meanwhile, the Moving Average Convergence Divergence (MACD) indicator holds above the signal line on the daily chart, but with contracting green histogram bars, momentum could be constrained in the short-term. The Relative Strength Index (RSI) near 51 on the same chart signals balanced conditions after the rebound from the sub-$70,000 region.
-1774001119226-1774001119229.png)
Initial resistance lies at the 50-day EMA around $72,684, followed by the weekly high at $76,000. A sustained breakout past that hurdle would expose Bitcoin to the 100-day EMA at $78,866.
On the downside, immediate support emerges around $70,200, ahead of $68,795, where prior reaction lows cluster and buyers recently defended the dip. A deeper setback would expose $65,822, matching the March 9 low.
Altcoins update: Ethereum and XRP test rebound strength
Ethereum is trading above $2,100, up from Thursday's low of $2,099. The near-term bias is neutral-to-bearish, as the smart contracts token hovers well below the 50-day, 100-day, and 200-day EMAs, which are clustered between roughly $2,212 and $2,813. Similarly, the descending trendline underscores that the broader trend remains bearish.
The MACD indicator remains in positive territory on the daily chart, but it has been slipping toward the signal line amid contracting histogram bars, suggesting fading upside momentum. The RSI near 51 on the same chart aligns with this stance, reflecting balanced forces after exiting near oversold conditions rather than a fully established uptrend.
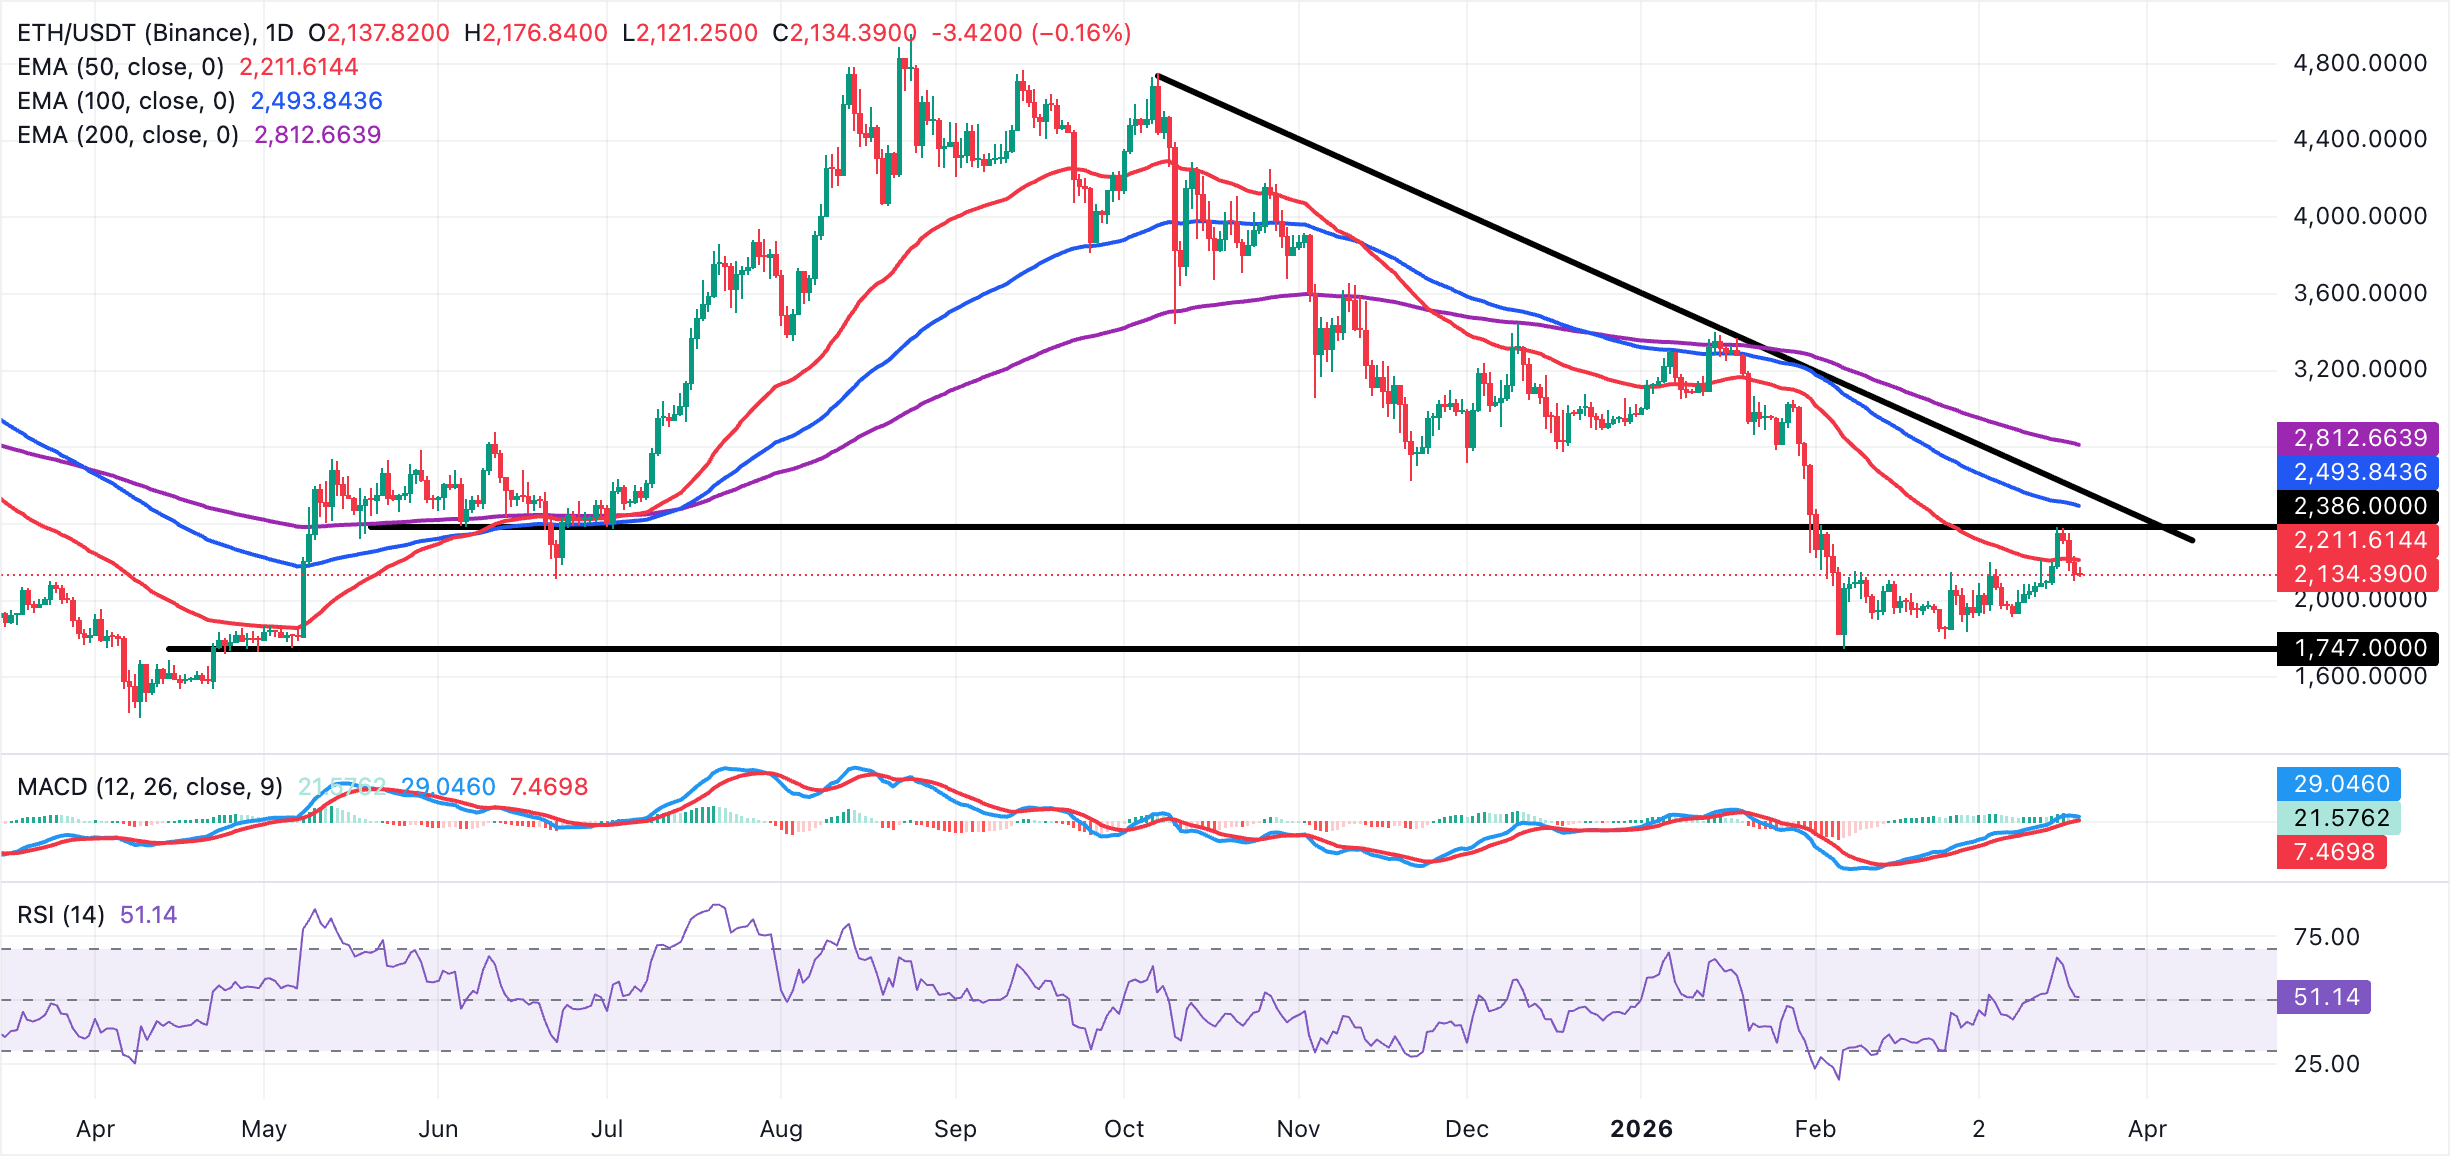
Initial resistance lies at the 50-day EMA around $2,212, followed by the recent reaction high at $2,386. A daily close above $2,386 would open the way toward the 100-day EMA at $2,495. On the downside, ETH is testing support at the $2,130 area, which limited advances during February. Further support is seen around $2,050 from the latest swing low region, followed by stronger demand near $1,750-$1,800, the base of the recent rebound. A break below $1,750 would weaken the nascent bullish tilt and expose deeper retracements within the broader bearish structure.
As for XRP, near-term bias is neutral with a slight bullish tilt after the pair bounced from the $1.42 area. The token holds well below the descending resistance trend line that has capped every rally since the $3.66 peak, keeping the broader structure corrective despite the latest recovery.
Daily closes remain under the 50-day, 100-day, and 200-day EMAs, clustered between roughly $1.50 and $1.95, so the rebound still unfolds within a larger downtrend. Momentum readings have weakened, with the RSI at 51 while the MACD remains above its signal line amid contracting green histograms on the daily chart.
-1774002882557-1774002882567.png)
Initial support emerges at $1.42, where XRP rebounded on Thursday, followed by $1.40, a pivotal reaction level. A break below $1.40 would weaken the nascent bullish tone and expose the next downside area near $1.30. On the topside, immediate resistance aligns at $1.50, followed by the weekly high at $1.61.
Cryptocurrency metrics FAQs
The developer or creator of each cryptocurrency decides on the total number of tokens that can be minted or issued. Only a certain number of these assets can be minted by mining, staking or other mechanisms. This is defined by the algorithm of the underlying blockchain technology. On the other hand, circulating supply can also be decreased via actions such as burning tokens, or mistakenly sending assets to addresses of other incompatible blockchains.
Market capitalization is the result of multiplying the circulating supply of a certain asset by the asset’s current market value.
Trading volume refers to the total number of tokens for a specific asset that has been transacted or exchanged between buyers and sellers within set trading hours, for example, 24 hours. It is used to gauge market sentiment, this metric combines all volumes on centralized exchanges and decentralized exchanges. Increasing trading volume often denotes the demand for a certain asset as more people are buying and selling the cryptocurrency.
Funding rates are a concept designed to encourage traders to take positions and ensure perpetual contract prices match spot markets. It defines a mechanism by exchanges to ensure that future prices and index prices periodic payments regularly converge. When the funding rate is positive, the price of the perpetual contract is higher than the mark price. This means traders who are bullish and have opened long positions pay traders who are in short positions. On the other hand, a negative funding rate means perpetual prices are below the mark price, and hence traders with short positions pay traders who have opened long positions.
(The technical analysis of this story was written with the help of an AI tool.)

Lebih dari satu juta pengguna mengandalkan FXStreet untuk data pasar real-time, alat charting, wawasan ahli, dan berita forex. Kalender ekonomi komprehensif dan webinar edukatif membantu trader tetap mendapat informasi dan membuat keputusan terukur. FXStreet memiliki sekitar 60 profesional yang tersebar antara kantor pusat Barcelona dan berbagai wilayah global.
Baca Selengkapnya


