
Dow Jones Industrial Average surges over 500 points on hopes Iran war nears resolution
Oleh Joshua Gibson
Diperbarui: 31 Mar 2026


ARTIKEL POPULER

The Dow Jones Industrial Average jumped around 500 points, or roughly 1.0%, on Tuesday as investors staged a recovery attempt on the final trading day of March. The S&P 500 gained 1.5% and the Nasdaq Composite advanced 2%.
- The Dow rallied more than 500 points as reports emerged that the US-Iran conflict could be winding down.
- Technology stocks led the rebound, with the Nasdaq Composite climbing 2% in a broad-based relief rally.
- Oil prices remained elevated after reports of an Iranian strike on a Kuwaiti tanker in Dubai waters.
- Consumer confidence edged higher in March but inflation expectations surged to levels last seen in August 2025.
The Dow Jones Industrial Average jumped around 500 points, or roughly 1.0%, on Tuesday as investors staged a recovery attempt on the final trading day of March. The S&P 500 gained 1.5% and the Nasdaq Composite advanced 2%. All three major indexes have been under significant pressure in recent weeks, with the Nasdaq still in correction territory, down more than 11% from its recent high. The Dow and S&P 500 are both within striking distance of corrections themselves, off more than 9% and 8%, respectively. The S&P 500 is on track for its worst monthly performance since September 2022.
Iran war headlines drive relief rally
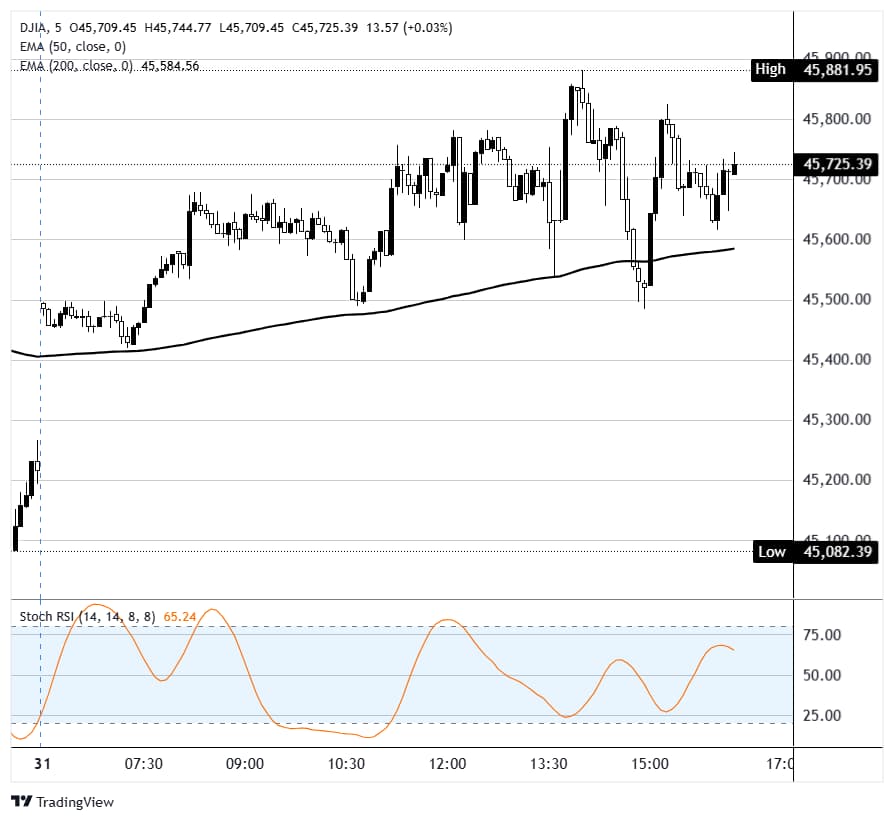
Tuesday's advance was fueled by reports suggesting the US-Iran conflict may be approaching a resolution. The Wall Street Journal reported that President Donald Trump told aides he was willing to end military hostilities even if the Strait of Hormuz remained largely shut. The New York Post later reported the president said he believes the war will likely end soon, with other nations taking the lead in reopening the Strait. The Dow opened near 45,200 before rallying sharply through the session, touching a high near 45,900 before settling around 45,700. The 50-period exponential moving average provided dynamic support throughout the afternoon on the 5-minute chart, while the Stochastic RSI closed in neutral territory around 68.
Tech stocks bounce from multi-week selloff
Technology, which has been under the most pressure since the conflict began, led Tuesday's bounce. The Technology Select Sector SPDR Fund traded 1.5% higher. Nvidia (NVDA) climbed 1% and Microsoft (MSFT) advanced 2%. Separately, Oracle (ORCL) popped 2.6% despite reports it had begun a round of layoffs numbering in the thousands. Shares of the software maker have fallen 27% year-to-date as investors weigh competitive risks from generative artificial intelligence models and the impact of infrastructure investments on cash flow.
Oil prices remain elevated despite diplomatic optimism
Crude prices stayed elevated even as peace hopes lifted equities. Brent crude futures rose 4% to trade above $117 per barrel after Bloomberg reported that Iran struck a Kuwaiti oil tanker in Dubai waters. West Texas Intermediate (WTI) futures advanced nearly 1% to above $103 per barrel. The energy sector has been the sole winner in March, up more than 12.5% for the month, while industrials have been the worst performer with a 10% decline. Healthcare and communication services are both off more than 9%.
Consumer confidence edges up but inflation fears mount
The Conference Board's Consumer Confidence Index (CCI) edged up to 91.8 in March from 91.0 in February, beating estimates of 87.9. The Present Situation Index rose 4.6 points to 123.3, while the Expectations Index slipped 1.7 points to 70.9. Beneath the headline, the picture was less encouraging. Inflation expectations surged as consumers cited rising Oil, gas and war-related costs. US gas prices jumped above $4 a gallon for the first time since 2022. Separately, the Job Openings and Labor Turnover Survey (JOLTS) showed job openings fell to 6.88 million in February from a revised 7.24 million in January, below the 6.92 million consensus. The Chicago Purchasing Managers Index (PMI) also retreated to 52.8 from 57.7, marking its third consecutive month of expansion but missing the 55 forecast.
Busy week ahead with NFP on Good Friday
Attention now turns to a compressed trading week ahead of the Easter holiday. Wednesday brings the ADP Employment Change report, where the consensus expects 40K private-sector jobs added after the prior month's 63K. Also on Wednesday, the Institute for Supply Management (ISM) Manufacturing PMI is expected at 52.5, roughly in line with the prior 52.4, alongside February retail sales. Thursday's calendar includes initial jobless claims and the Challenger Job Cuts report. The main event is Friday's Nonfarm Payrolls (NFP) report, where the consensus expects 60K jobs added after February's shock loss of 92K. However, NFP falls on Good Friday with US equity and bond markets closed, meaning the full market reaction will be deferred to Monday, April 6. A sharp surprise in either direction could produce significant opening gaps across equities, rates and foreign exchange at Monday's open.
Dow Jones 5-minute chart
Dow Jones FAQs
The Dow Jones Industrial Average, one of the oldest stock market indices in the world, is compiled of the 30 most traded stocks in the US. The index is price-weighted rather than weighted by capitalization. It is calculated by summing the prices of the constituent stocks and dividing them by a factor, currently 0.152. The index was founded by Charles Dow, who also founded the Wall Street Journal. In later years it has been criticized for not being broadly representative enough because it only tracks 30 conglomerates, unlike broader indices such as the S&P 500.
Many different factors drive the Dow Jones Industrial Average (DJIA). The aggregate performance of the component companies revealed in quarterly company earnings reports is the main one. US and global macroeconomic data also contributes as it impacts on investor sentiment. The level of interest rates, set by the Federal Reserve (Fed), also influences the DJIA as it affects the cost of credit, on which many corporations are heavily reliant. Therefore, inflation can be a major driver as well as other metrics which impact the Fed decisions.
Dow Theory is a method for identifying the primary trend of the stock market developed by Charles Dow. A key step is to compare the direction of the Dow Jones Industrial Average (DJIA) and the Dow Jones Transportation Average (DJTA) and only follow trends where both are moving in the same direction. Volume is a confirmatory criteria. The theory uses elements of peak and trough analysis. Dow’s theory posits three trend phases: accumulation, when smart money starts buying or selling; public participation, when the wider public joins in; and distribution, when the smart money exits.
There are a number of ways to trade the DJIA. One is to use ETFs which allow investors to trade the DJIA as a single security, rather than having to buy shares in all 30 constituent companies. A leading example is the SPDR Dow Jones Industrial Average ETF (DIA). DJIA futures contracts enable traders to speculate on the future value of the index and Options provide the right, but not the obligation, to buy or sell the index at a predetermined price in the future. Mutual funds enable investors to buy a share of a diversified portfolio of DJIA stocks thus providing exposure to the overall index.

Lebih dari satu juta pengguna mengandalkan FXStreet untuk data pasar real-time, alat charting, wawasan ahli, dan berita forex. Kalender ekonomi komprehensif dan webinar edukatif membantu trader tetap mendapat informasi dan membuat keputusan terukur. FXStreet memiliki sekitar 60 profesional yang tersebar antara kantor pusat Barcelona dan berbagai wilayah global.
Baca Selengkapnya


