
Ethereum Price Forecast: BitMine slows accumulation as ETH drops below $2,000
Oleh Michael Ebiekutan
Diperbarui: 1 Jun 2026


ARTIKEL POPULER

BitMine Immersion Technologies (BMNR) has slowed its weekly Ethereum (ETH) accumulation, purchasing 26,497 ETH last week. That figure represents its third-lowest acquisition since pivoting to an ETH treasury in 2025.
Ethereum price today: $1,980
- BitMine purchased 26,497 ETH last week, its third-lowest weekly acquisition since pivoting to an Ethereum treasury model.
- The company's ETH holdings are underwater by roughly $9 billion.
- ETH could bounce off the $1,909 support level.
BitMine Immersion Technologies (BMNR) has slowed its weekly Ethereum (ETH) accumulation, purchasing 26,497 ETH last week. That figure represents its third-lowest acquisition since pivoting to an ETH treasury in 2025.
The latest acquisition has lifted the company's holdings to 5.41 million ETH worth $10.72 billion as of writing. BitMine also reported it holds 203 Bitcoin (BTC), a $180 million stake in Beast Industries, $93 million in Eightco Holdings (ORBS) shares and total cash of $446 million.
"In our view, ETH prices are not reflecting the strengthening of Ethereum fundamentals, but then again, this is not surprising given we are in the early stages of crypto spring," said Bitmine Chairman Thomas Lee in a Monday statement.
The slowdown in BitMine's weekly ETH acquisition follows comments from Lee that the company will decrease its buying pace as it is ahead of its original schedule to acquire 5% of ETH's circulating supply.
Declining sentiment across the crypto market is also weighing on BitMine. The company's ETH holdings are underwater by roughly $9 billion, according to CryptoQuant data.
Apart from BitMine, other digital asset treasuries (DATs) are also under pressure. The largest crypto treasury, Strategy, disclosed that it sold 32 BTC for $2.5 million last week. The sale is expected to fund its preferred stock dividends.
Meanwhile, US spot Ethereum exchange-traded funds (ETFs) have recorded a third consecutive week of net outflows, indicating sustained institutional risk-off sentiment, per SoSoValue data.
Ethereum Price Forecast: ETH eyes the $1,909 support
Ethereum recorded $106.3 million in liquidations over the past 24 hours, driven by $90.3 million in long liquidations, according to Coinglass data.
On the daily chart, ETH is extending its slide beneath a dense band of Exponential Moving Averages and reinforcing a bearish near-term bias. Price holds under the 20-, 50-, and 100-day EMAs at $2,098, $2,172, and $2,269, suggesting rallies are likely to face resistance at these levels, which cap the upside.
Momentum readings underscore downside pressure, with the 14-day Relative Strength Index (RSI) hovering around 30 and the Stochastic Oscillator (Stoch) deep in oversold territory, suggesting that while selling remains dominant, the move is becoming stretched.
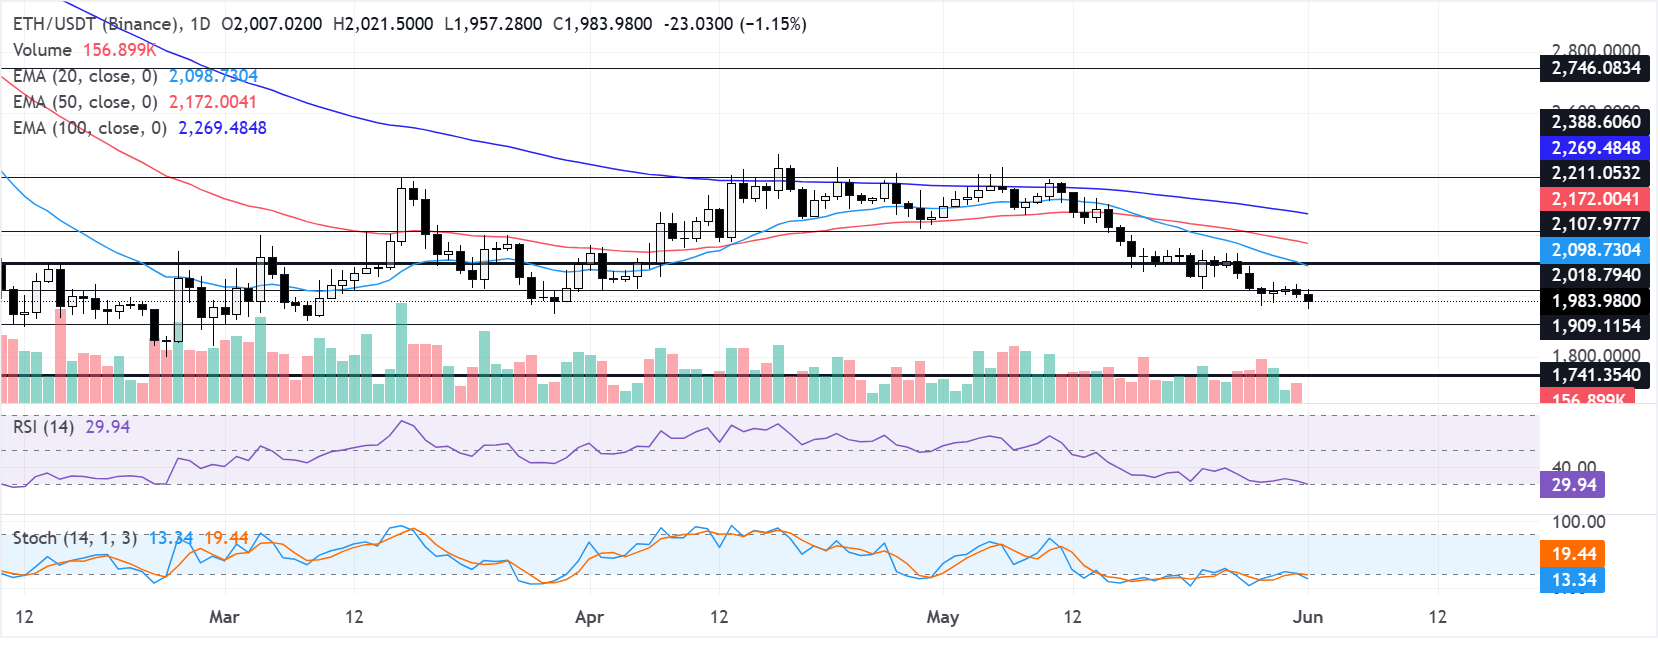
On the upside, initial resistance appears at the horizontal barrier near $2,018, followed by $2,107 and the 50-day EMA at $2,172. Further hurdles are at $2,211 and the 100-day EMA at $2,269 before the stronger ceilings at $2,388 and $2,746.
On the downside, immediate support is seen at $1,909. A break below this level would expose the next demand zone around $1,741, ahead of deeper supports at $1,524 and $1,404 if bearish momentum persists.
(The technical analysis of this story was written with the help of an AI tool.)

Lebih dari satu juta pengguna mengandalkan FXStreet untuk data pasar real-time, alat charting, wawasan ahli, dan berita forex. Kalender ekonomi komprehensif dan webinar edukatif membantu trader tetap mendapat informasi dan membuat keputusan terukur. FXStreet memiliki sekitar 60 profesional yang tersebar antara kantor pusat Barcelona dan berbagai wilayah global.
Baca Selengkapnya


