
EUR/JPY Price Forecast: Eyes triangle top near 185.00 as bullish bias holds
Oleh Akhtar Faruqui
Diperbarui: 6 Apr 2026


ARTIKEL POPULER

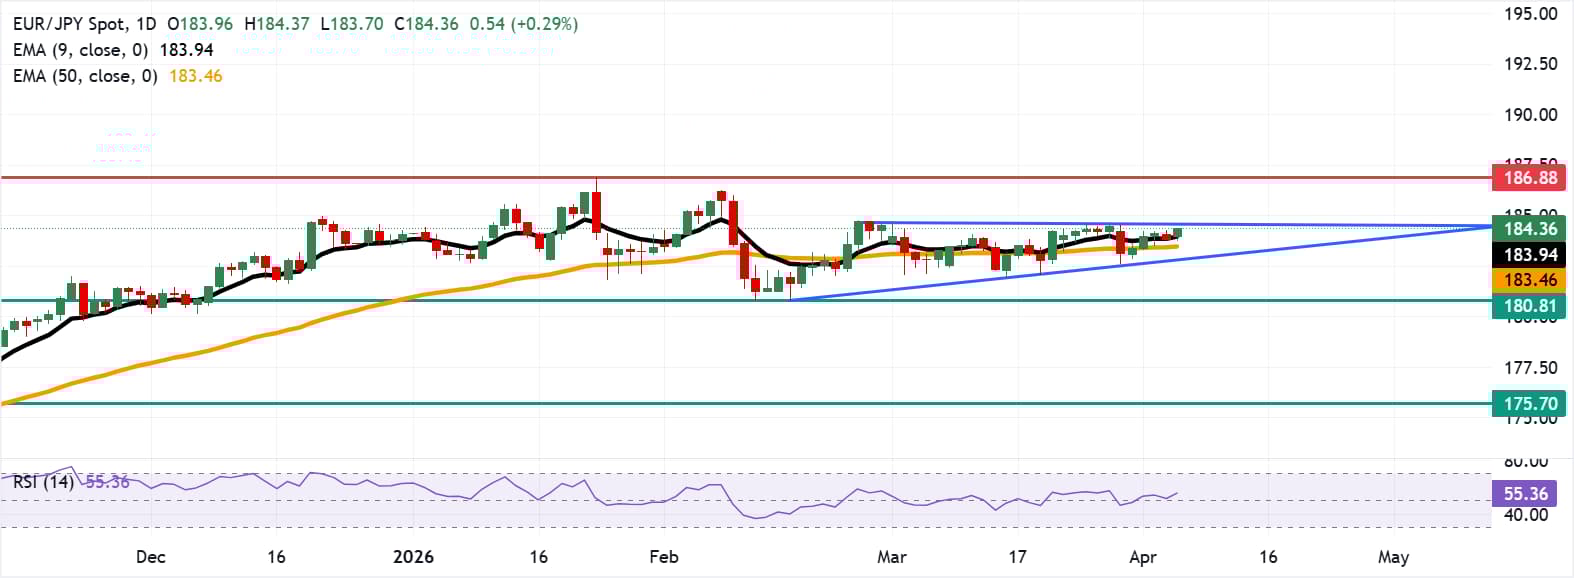
EUR/JPY recovers its recent losses from the previous trading day, hovering around 184.40 during the European hours on Monday. The technical analysis of the daily chart suggests the currency cross is moving sideways within an ascending triangle pattern, indicating consolidation.
- EUR/JPY may test the immediate barrier at the upper ascending triangle boundary around 184.70.
- The Relative Strength Index is at 55.36, signaling moderate buying pressure.
- The pair may find immediate support at the psychological level of 184.00.
EUR/JPY recovers its recent losses from the previous trading day, hovering around 184.40 during the European hours on Monday. The technical analysis of the daily chart suggests the currency cross is moving sideways within an ascending triangle pattern, indicating consolidation. A sustained move above the triangle would confirm bullish continuation.
However, the EUR/JPY cross holds a mild bullish bias as price action consolidates above the 50-day Exponential Moving Average while also respecting the faster nine-day average as dynamic support. The short-term average remains above the medium-term gauge, preserving an upward configuration despite the recent sideways candles. The 14-day Relative Strength Index (RSI) at 55.36 stays above the 50 midline, indicating moderate buying pressure rather than overextended momentum.
The immediate resistance lies at the upper ascending triangle boundary around 184.70. Further advances above the triangle would reinforce the bullish bias and lead the EUR/JPY cross to explore the region around the all-time high of 186.88, reached on January 23.
On the downside, the immediate support lies at the psychological level of 184.00, followed by the nine-day EMA of 183.94. Further support lies at the 50-day EMA at 183.46, followed by the lower boundary of the ascending triangle around 182.90. A break below the triangle would cause the emergence of the bearish bias and put downward pressure on the EUR/JPY cross to test a nearly four-month low of 180.81, recorded on February 12.
(The technical analysis of this story was written with the help of an AI tool.)
Euro Price Today
The table below shows the percentage change of Euro (EUR) against listed major currencies today. Euro was the strongest against the US Dollar.
| USD | EUR | GBP | JPY | CAD | AUD | NZD | CHF | |
|---|---|---|---|---|---|---|---|---|
| USD | -0.41% | -0.41% | -0.19% | -0.19% | -0.51% | -0.55% | -0.38% | |
| EUR | 0.41% | 0.02% | 0.20% | 0.23% | -0.11% | -0.16% | 0.01% | |
| GBP | 0.41% | -0.02% | 0.19% | 0.18% | -0.13% | -0.19% | 0.01% | |
| JPY | 0.19% | -0.20% | -0.19% | 0.01% | -0.34% | -0.39% | -0.21% | |
| CAD | 0.19% | -0.23% | -0.18% | -0.01% | -0.32% | -0.37% | -0.20% | |
| AUD | 0.51% | 0.11% | 0.13% | 0.34% | 0.32% | -0.06% | 0.13% | |
| NZD | 0.55% | 0.16% | 0.19% | 0.39% | 0.37% | 0.06% | 0.20% | |
| CHF | 0.38% | -0.01% | -0.01% | 0.21% | 0.20% | -0.13% | -0.20% |
The heat map shows percentage changes of major currencies against each other. The base currency is picked from the left column, while the quote currency is picked from the top row. For example, if you pick the Euro from the left column and move along the horizontal line to the US Dollar, the percentage change displayed in the box will represent EUR (base)/USD (quote).

Lebih dari satu juta pengguna mengandalkan FXStreet untuk data pasar real-time, alat charting, wawasan ahli, dan berita forex. Kalender ekonomi komprehensif dan webinar edukatif membantu trader tetap mendapat informasi dan membuat keputusan terukur. FXStreet memiliki sekitar 60 profesional yang tersebar antara kantor pusat Barcelona dan berbagai wilayah global.
Baca Selengkapnya


