
GBP/JPY Price Forecast: Buyers defend 100-day SMA as momentum weakens
Oleh Vishal Chaturvedi
Diperbarui: 1 May 2026


ARTIKEL POPULER

GBP/JPY stages a modest rebound on Friday after coming under selling pressure earlier in the day amid suspected intervention by Tokyo for a second straight day to curb excessive weakness in the Japanese Yen (JPY).
- GBP/JPY rebounds modestly after earlier sell-off likely triggered by suspected intervention by Japanese authorities.
- Technically, the cross holds a bullish bias above key moving averages, though weakening momentum signals fading upside strength.
- The 100-day SMA offers immediate support, while 213.50 acts as the first upside hurdle.
GBP/JPY stages a modest rebound on Friday after coming under selling pressure earlier in the day amid suspected intervention by Tokyo for a second straight day to curb excessive weakness in the Japanese Yen (JPY). At the time of writing, the cross is trading around 213.42, recovering from an intraday low of 211.81 and poised to end the week in negative territory for the first time in four weeks.
However, there has been no official confirmation of intervention by Japanese authorities so far, though officials issued a “final” warning on Thursday after USD/JPY briefly moved past the 160 level, a threshold that has previously triggered action. This move spilled across Yen crosses, with GBP/JPY posting a sharp pullback from a multi-year high near 216.60 to around 210.45 the previous day.
Although underlying fundamentals, including wide interest rate differentials between the Bank of Japan (BoJ) and other major central banks, continue to weigh on the Yen, the latest leg lower suggests near-term downside pressure on the cross as momentum indicators turn negative.
Technical Analysis:
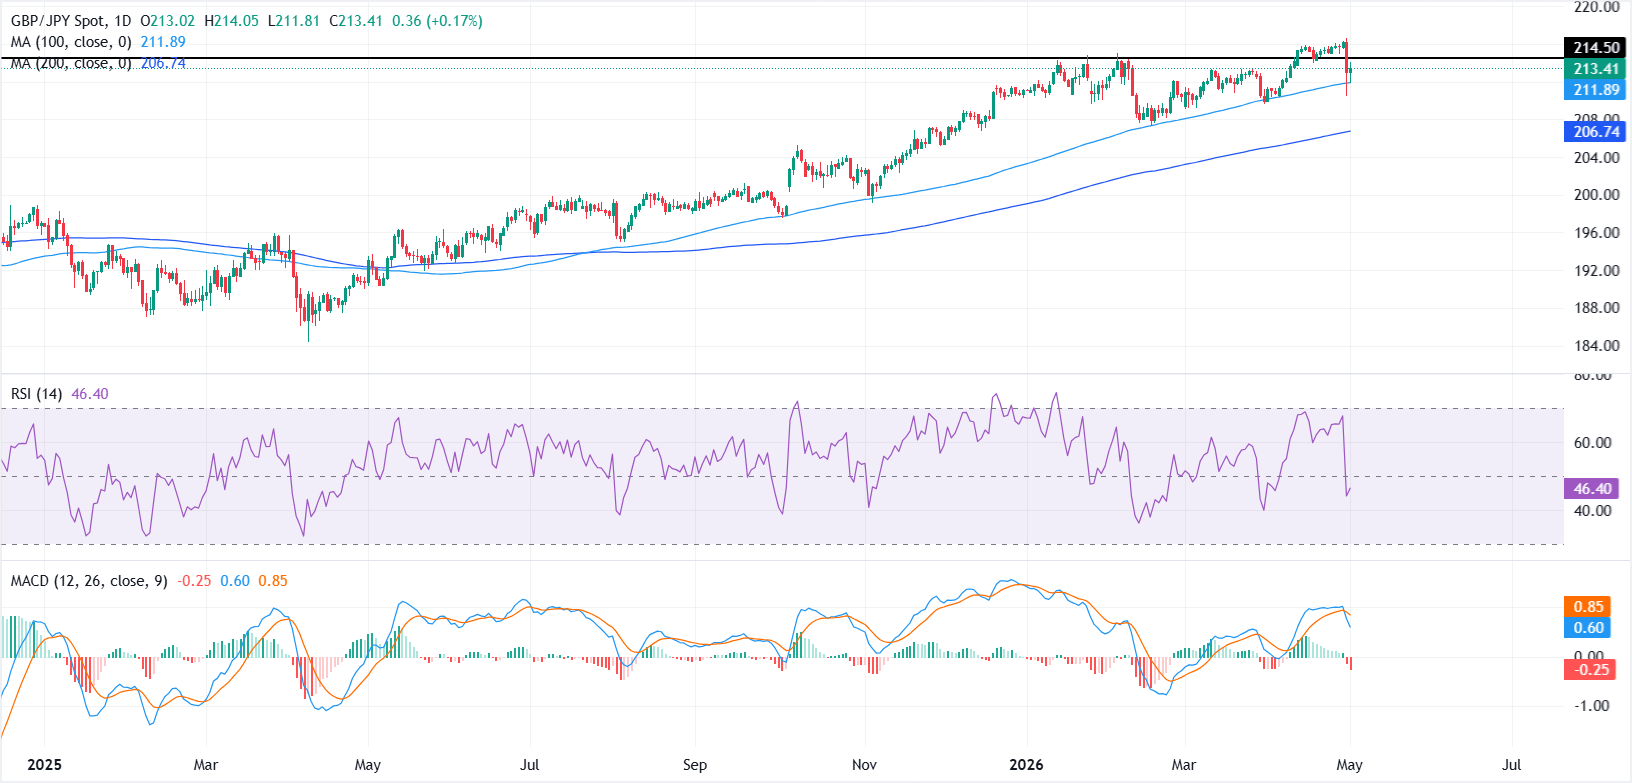
In the daily chart, GBP/JPY holds a constructive bias while consolidating above its key trend filters. The 100-day Simple Moving Average (SMA) at 211.89 and the 200-day SMA at 206.74 sit comfortably below the spot, suggesting underlying demand despite the recent pullback.
However, momentum has cooled, with the Relative Strength Index easing toward the mid-40s and the Moving Average Convergence Divergence (MACD) slipping into negative territory, hinting that upside attempts may lack follow-through in the very near term.
On the topside, immediate resistance is located at the horizontal barrier near 214.50, where a daily close above would reopen the path toward the recent peak of 216.60 and signal renewed bullish impulse.
On the downside, initial support is provided by the 100-day SMA at 211.89, with a break there exposing deeper retracement toward the 200-day SMA at 206.74, where buyers would be expected to defend the broader uptrend.
(The technical analysis of this story was written with the help of an AI tool.)
Japanese Yen Price Today
The table below shows the percentage change of Japanese Yen (JPY) against listed major currencies today. Japanese Yen was the strongest against the New Zealand Dollar.
| USD | EUR | GBP | JPY | CAD | AUD | NZD | CHF | |
|---|---|---|---|---|---|---|---|---|
| USD | -0.19% | -0.14% | 0.02% | -0.19% | -0.06% | 0.12% | -0.11% | |
| EUR | 0.19% | 0.04% | 0.18% | -0.01% | 0.15% | 0.30% | 0.08% | |
| GBP | 0.14% | -0.04% | 0.15% | -0.04% | 0.09% | 0.26% | 0.06% | |
| JPY | -0.02% | -0.18% | -0.15% | -0.20% | -0.08% | 0.07% | -0.12% | |
| CAD | 0.19% | 0.01% | 0.04% | 0.20% | 0.12% | 0.29% | 0.10% | |
| AUD | 0.06% | -0.15% | -0.09% | 0.08% | -0.12% | 0.16% | -0.02% | |
| NZD | -0.12% | -0.30% | -0.26% | -0.07% | -0.29% | -0.16% | -0.20% | |
| CHF | 0.11% | -0.08% | -0.06% | 0.12% | -0.10% | 0.02% | 0.20% |
The heat map shows percentage changes of major currencies against each other. The base currency is picked from the left column, while the quote currency is picked from the top row. For example, if you pick the Japanese Yen from the left column and move along the horizontal line to the US Dollar, the percentage change displayed in the box will represent JPY (base)/USD (quote).

Lebih dari satu juta pengguna mengandalkan FXStreet untuk data pasar real-time, alat charting, wawasan ahli, dan berita forex. Kalender ekonomi komprehensif dan webinar edukatif membantu trader tetap mendapat informasi dan membuat keputusan terukur. FXStreet memiliki sekitar 60 profesional yang tersebar antara kantor pusat Barcelona dan berbagai wilayah global.
Baca Selengkapnya


