
GBP/JPY Price Forecast: Holds in a tight range between 50-day and 100-day SMAs
Oleh Vishal Chaturvedi
Diperbarui: 2 Apr 2026


ARTIKEL POPULER

GBP/JPY trades with a mild downside bias on Thursday, though it lacks strong follow-through selling and trims part of its intraday losses as markets remain volatile.
- GBP/JPY holds a mild downside bias, though limited follow-through selling keeps price action choppy.
- British Pound comes under pressure amid the geopolitical backdrop, while the Yen holds steady against most majors.
- Technically, the cross trades within a tight range between the 50-day and 100-day SMAs, signaling consolidation.
GBP/JPY trades with a mild downside bias on Thursday, though it lacks strong follow-through selling and trims part of its intraday losses as markets remain volatile. Ongoing US-Israel war with Iran keeps sentiment fragile, weighing on the British Pound (GBP), while the Japanese Yen (JPY) holds firm across major peers except the US Dollar (USD) and Canadian Dollar (CAD).
At the time of writing, the cross is trading around 210.90, attempting a rebound after sliding to 210.35 during the Asian session.
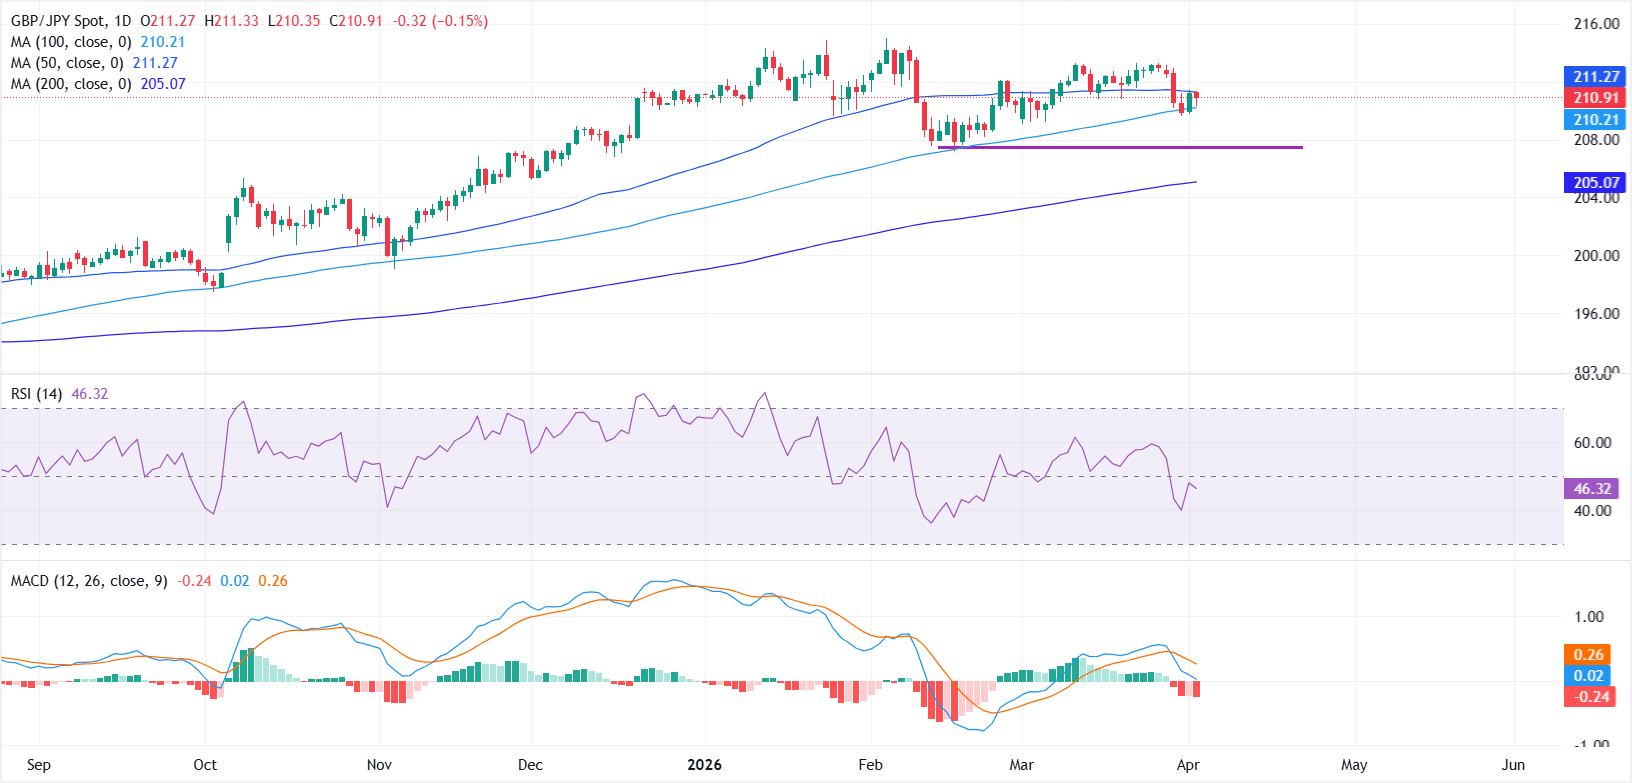
From a technical perspective, the daily chart shows near-term consolidation, with prices trapped between the 100-day and 50-day Simple Moving Average (SMAs) at 210.21 and 211.27, respectively.
Momentum indicators suggest a mildly bearish undertone. The Relative Strength Index (RSI) hovers around 46, holding below the neutral 50 mark, indicating subdued buying interest.
Meanwhile, the Moving Average Convergence Divergence (MACD) shows early signs of weakening momentum, with the MACD line slipping below the signal line and the histogram turning slightly negative.
On the downside, a decisive break below the 100-day SMA could expose the 207.50 support zone, which marks the February swing low. A sustained move below this level would shift focus toward the 200-day SMA near 205.00.
On the upside, a recovery above the 50-day SMA would be needed to ease immediate downside pressure. A sustained break higher could open the door toward the 213.50 resistance area, marked by recent highs, followed by the February peak near 215.00.
Japanese Yen Price Today
The table below shows the percentage change of Japanese Yen (JPY) against listed major currencies today. Japanese Yen was the strongest against the British Pound.
| USD | EUR | GBP | JPY | CAD | AUD | NZD | CHF | |
|---|---|---|---|---|---|---|---|---|
| USD | 0.55% | 0.71% | 0.53% | 0.31% | 0.67% | 0.70% | 0.59% | |
| EUR | -0.55% | 0.16% | -0.07% | -0.27% | 0.13% | 0.16% | 0.02% | |
| GBP | -0.71% | -0.16% | -0.21% | -0.40% | -0.03% | 0.01% | -0.14% | |
| JPY | -0.53% | 0.07% | 0.21% | -0.21% | 0.15% | 0.18% | 0.06% | |
| CAD | -0.31% | 0.27% | 0.40% | 0.21% | 0.36% | 0.38% | 0.26% | |
| AUD | -0.67% | -0.13% | 0.03% | -0.15% | -0.36% | 0.03% | -0.13% | |
| NZD | -0.70% | -0.16% | -0.01% | -0.18% | -0.38% | -0.03% | -0.14% | |
| CHF | -0.59% | -0.02% | 0.14% | -0.06% | -0.26% | 0.13% | 0.14% |
The heat map shows percentage changes of major currencies against each other. The base currency is picked from the left column, while the quote currency is picked from the top row. For example, if you pick the Japanese Yen from the left column and move along the horizontal line to the US Dollar, the percentage change displayed in the box will represent JPY (base)/USD (quote).

Lebih dari satu juta pengguna mengandalkan FXStreet untuk data pasar real-time, alat charting, wawasan ahli, dan berita forex. Kalender ekonomi komprehensif dan webinar edukatif membantu trader tetap mendapat informasi dan membuat keputusan terukur. FXStreet memiliki sekitar 60 profesional yang tersebar antara kantor pusat Barcelona dan berbagai wilayah global.
Baca Selengkapnya


