
GBP/USD trips down below 1.3350 as oil surges, Fed outlook boosts USD
Oleh Christian Borjon Valencia
Tanggal Diterbitkan: 20 Mar 2026 | Tanggal Dimodifikasi: 20 Mar 2026


ARTIKEL POPULER

The GBP/USD trims some of its Thursday’s gains, down by 0.84%, as traders turned risk-averse amid an escalation of the Middle East conflict and priced in no rate cuts by the Federal Reserve in 2026. At the time of writing, the pair trades below 1.3350 after hitting a daily high of 1.3442.
- GBP/USD drops 0.84% after hitting 1.3442, pressured by risk aversion and strong Dollar.
- Oil-driven inflation fears lift DXY 0.48% as Fed signals no cuts in 2026.
- BoE unanimous hold sparks repricing, with markets eyeing 78 bps of hikes this year.
The GBP/USD trims some of its Thursday’s gains, down by 0.84%, as traders turned risk-averse amid an escalation of the Middle East conflict and priced in no rate cuts by the Federal Reserve in 2026. At the time of writing, the pair trades below 1.3350 after hitting a daily high of 1.3442.
Sterling retreats as rising energy prices and hawkish Fed stance fuel Greenback demand
The jump in Crude Oil prices continues to underpin the Greenback, which, according to the US Dollar Index (DXY), which measures the performance of the American currency against six others, is up 0.48%.
On Thursday, the Bank of England (BoE) kept the Bank Rate unchanged amid external inflationary shocks, spurred by the US-Israeli war on Iran. Surprisingly, the BoE’s vote split was 9-0, triggering an aggressive repricing of rate hikes, with money markets expecting the UK central bank to increase rates by 78 basis points towards the end of the year.
In the US, the Federal Reserve kept the Fed funds rate steady, with Fed Chair Jerome Powell striking a neutral-hawkish tone at his press conference, saying, “If I don’t see inflation progress, I won’t see a rate cut.” He warned that the Iran war is likely to drive up inflation.
Recently, Fed Governor Christopher Waller said that, based on the jobs report, he planned to dissent and vote for a rate cut, but since then inflation has become the main concern, he commented in a CNBC interview. Waller added that “if Oil stays high for months on end at some point, it bleeds into core inflation.”
Fed Governor Michelle Bowman also crossed the wires, stating that she had penciled in three rate cuts this year. She added that she expects strong economic growth and that she still sees a weak labor market.
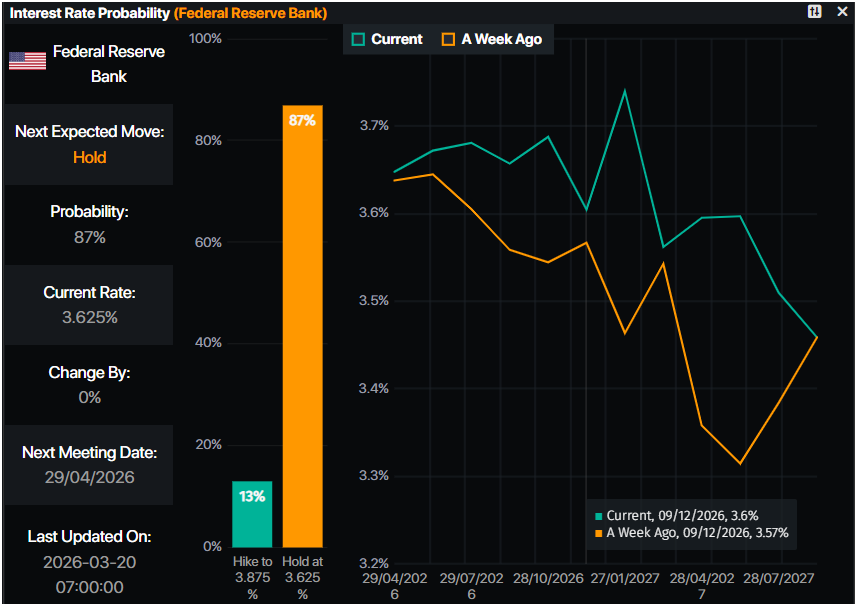
Given the backdrop, money markets do not expect a rate cut by the Fed, instead the odds for a rate hike at the next meeting, are at 13%, according to Prime Market Terminal data.
Next week, the US economic docket will feature Flash PMIs and the Current Account. Jobless claims and Wholesale Inventories. For the UK, traders will also eye Flash PMIs and inflation figures, namely the Consumer Price Index (CPI) and the Producer Price Index (PPI).
GBP/USD Price Forecast: Technical outlook
In the daily chart, GBP/USD trades at 1.3313. The near-term bias stays mildly bearish as spot holds below the descending resistance line from 1.3869 and beneath the clustered simple moving averages around 1.3500, confirming persistent selling pressure on rallies. Price has also slipped away from the earlier break above the rising support line from 1.3035, signaling fading upside momentum after repeated failures near the mid-1.36s. The Fed Sentiment Index remains in a lower band compared with its earlier highs, aligning with a softer macro backdrop for the pair and limiting the scope for an immediate bullish reversal.
Initial resistance is now seen near 1.3400, where recent highs converge with the underside of the broken support structure, followed by the moving-average zone around 1.3500 and then the descending trend-line region toward 1.3650. On the downside, the day’s open at 1.3313 is the first level to watch, with further support emerging near 1.3250 ahead of the rising trend-line origin around 1.3035. A daily close below 1.3250 would confirm continuation of the corrective leg toward the low 1.30s, while recovery above 1.3500 would be needed to challenge the bearish bias and expose the 1.3650 area again.
(The technical analysis of this story was written with the help of an AI tool.)
Pound Sterling Price This week
The table below shows the percentage change of British Pound (GBP) against listed major currencies this week. British Pound was the strongest against the Canadian Dollar.
| USD | EUR | GBP | JPY | CAD | AUD | NZD | CHF | |
|---|---|---|---|---|---|---|---|---|
| USD | -1.06% | -0.59% | -0.29% | 0.12% | -0.62% | -0.80% | -0.17% | |
| EUR | 1.06% | 0.49% | 0.68% | 1.19% | 0.46% | 0.26% | 0.90% | |
| GBP | 0.59% | -0.49% | 0.34% | 0.69% | -0.02% | -0.23% | 0.47% | |
| JPY | 0.29% | -0.68% | -0.34% | 0.45% | -0.32% | -0.48% | 0.16% | |
| CAD | -0.12% | -1.19% | -0.69% | -0.45% | -0.78% | -0.91% | -0.26% | |
| AUD | 0.62% | -0.46% | 0.02% | 0.32% | 0.78% | -0.20% | 0.46% | |
| NZD | 0.80% | -0.26% | 0.23% | 0.48% | 0.91% | 0.20% | 0.61% | |
| CHF | 0.17% | -0.90% | -0.47% | -0.16% | 0.26% | -0.46% | -0.61% |
The heat map shows percentage changes of major currencies against each other. The base currency is picked from the left column, while the quote currency is picked from the top row. For example, if you pick the British Pound from the left column and move along the horizontal line to the US Dollar, the percentage change displayed in the box will represent GBP (base)/USD (quote).

Lebih dari satu juta pengguna mengandalkan FXStreet untuk data pasar real-time, alat charting, wawasan ahli, dan berita forex. Kalender ekonomi komprehensif dan webinar edukatif membantu trader tetap mendapat informasi dan membuat keputusan terukur. FXStreet memiliki sekitar 60 profesional yang tersebar antara kantor pusat Barcelona dan berbagai wilayah global.
Baca Selengkapnya


