
Litecoin Price Analysis: Bearish sentiment grows, $50 emerges as next target
Oleh Manish Chhetri
Tanggal Diterbitkan: 19 Feb 2026 | Tanggal Dimodifikasi: 19 Feb 2026


ARTIKEL POPULER

Litecoin (LTC) trades in red below $54 at the time of writing on Thursday, after correcting by over 3% so far this week.
- Litecoin price trades below $54 on Thursday, falling over 3% so far this week.
- Derivatives data support bearish sentiment, with open interest at very low levels and rising short bets.
- The technical outlook suggests sellers are in control, with $50 emerging as the next downside target.
Litecoin (LTC) trades in red below $54 at the time of writing on Thursday, after correcting by over 3% so far this week. The bearish price action is further supported by derivatives data, as Open Interest (OI) has been falling steadily alongside rising short bets, while the technical outlook remains unfavorable.
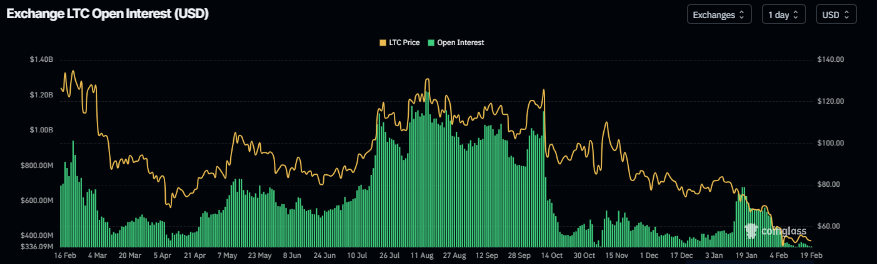
Litecoin derivatives data shows fading investor sentiment
Litecoin futures OI falls to $341.27 million on Thursday, having been steadily declining since mid-January. This drop in OI reflects waning investor participation and projects a bearish outlook.
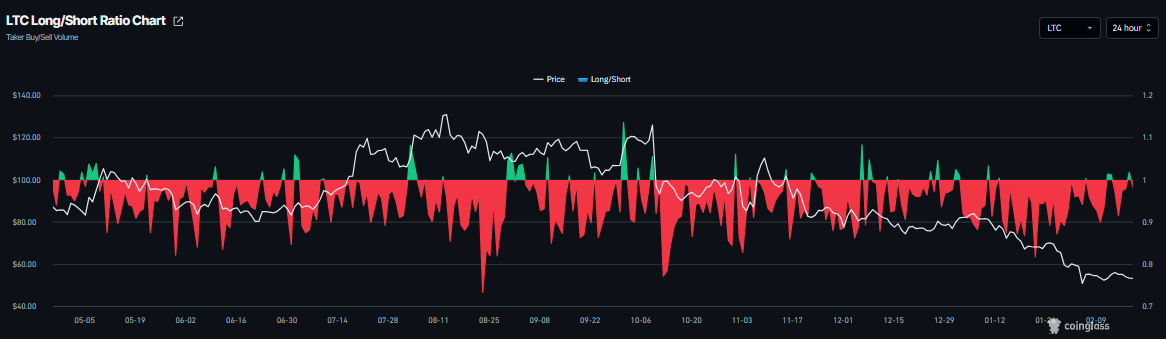
In addition, Litecoin's long-to-short ratio reads 0.98 on Thursday and has failed to remain above 1 for the third time so far this month, signaling that traders are reluctant to add long positions. This ratio below 1 indicates bearish sentiment as traders are betting on the asset price to fall.
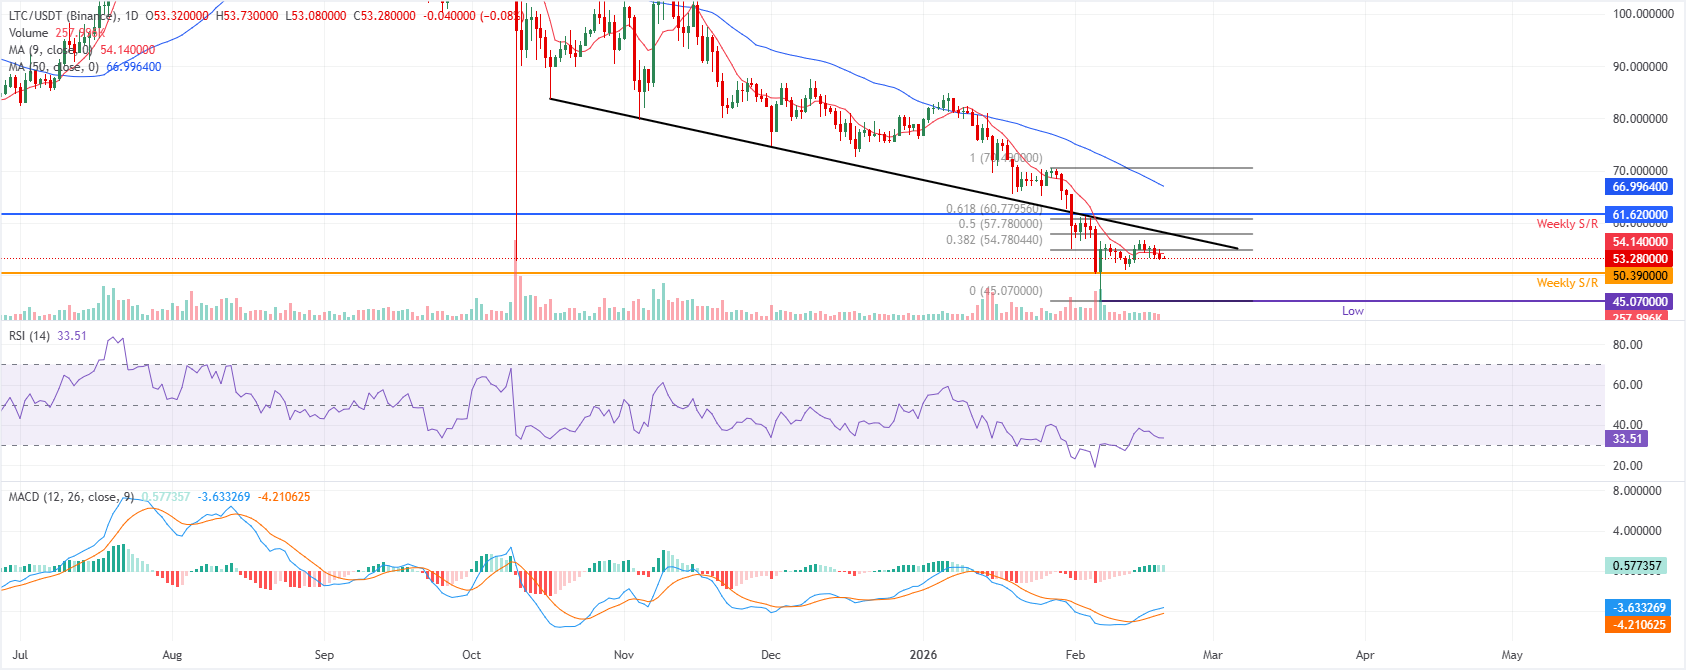
Litecoin Price Forecast: LTC bears aiming for the $50 mark
Litecoin's trades at $53.28 as of writing on Thursday. The 9-day Simple Moving Average (SMA) at $54.14 remains below the 50-day SMA at $66.99, with both sloping lower to underscore a bearish setup.
Price holds beneath these gauges, keeping sellers in control. On the daily chart, the Moving Average Convergence Divergence (MACD) line stands above the Signal line and marginally above zero, but the histogram has started to contract, suggesting fading upside momentum. The Relative Strength Index (RSI) sits at 33 (neutral-to-bearish) below the midline, reflecting subdued demand.
Measured from the $70.49 high to the $45.07 low, the 38.2% Fibonacci retracement at $54.78 acts as initial resistance, with the 50% retracement at $57.78 capping the next recovery attempt.
On the downside, support is seen at $50.39, its weekly level. A daily close above $54.78 would ease immediate downside pressure and open room toward $57.78, while failure to reclaim that barrier would keep focus on $50.39 and maintain the broader bearish bias.
(The technical analysis of this story was written with the help of an AI tool.)

Lebih dari satu juta pengguna mengandalkan FXStreet untuk data pasar real-time, alat charting, wawasan ahli, dan berita forex. Kalender ekonomi komprehensif dan webinar edukatif membantu trader tetap mendapat informasi dan membuat keputusan terukur. FXStreet memiliki sekitar 60 profesional yang tersebar antara kantor pusat Barcelona dan berbagai wilayah global.
Baca Selengkapnya


