
New Zealand's Kiwi is promised the most hikes and shown the least respect
Oleh Joshua Gibson
Diperbarui: 10 Jun 2026


ARTIKEL POPULER

The New Zealand Dollar is carrying the steepest implied tightening path in the developed world and trading like a currency nobody told.
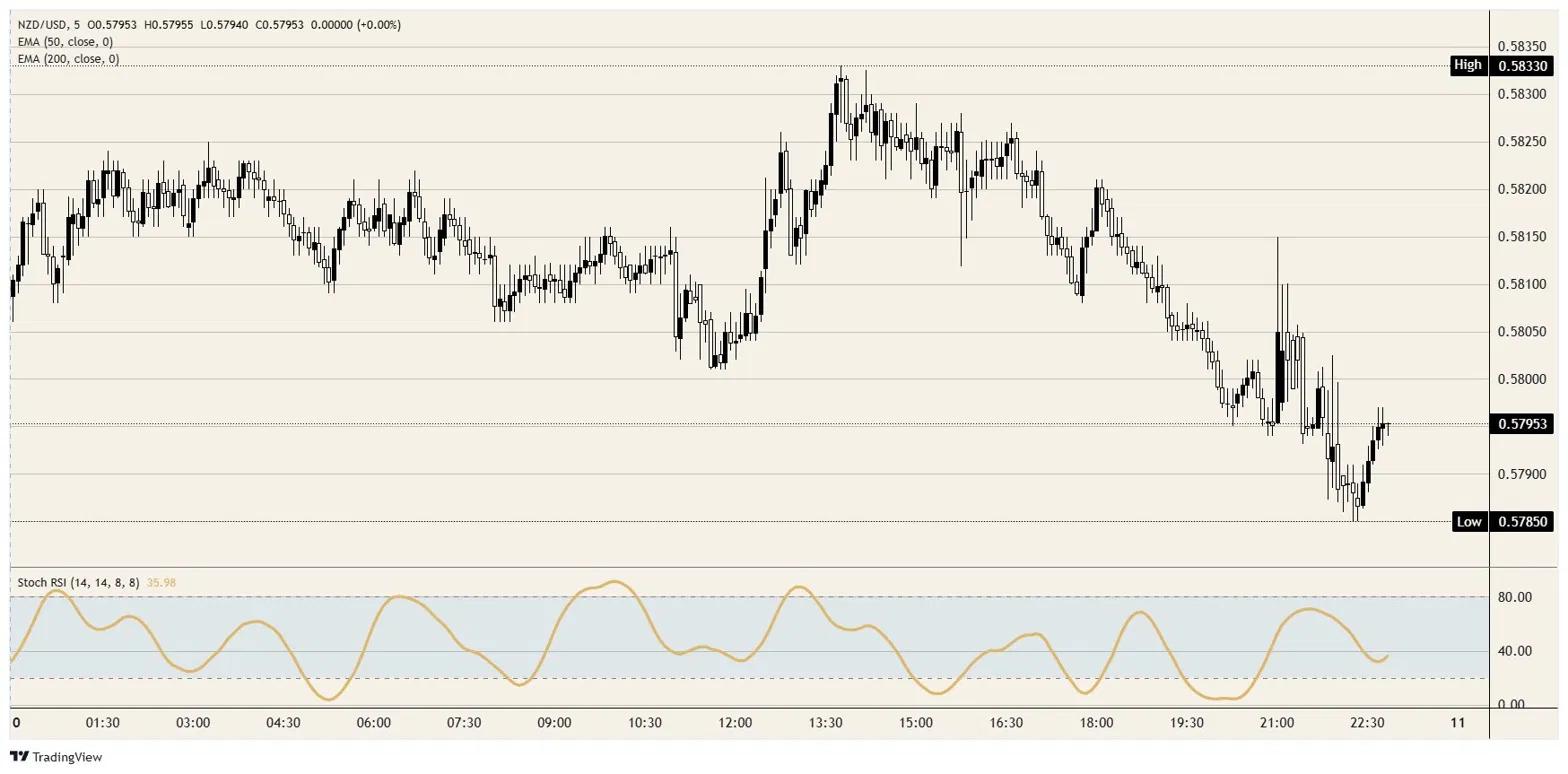
- NZD/USD closed below its 200-day EMA after another faded rally.
- RBNZ guidance points to hikes this year and the market is not paying for it.
- Q1 GDP lands next week only hours after the Fed decision.
The New Zealand Dollar is carrying the steepest implied tightening path in the developed world and trading like a currency nobody told. NZD/USD followed Wednesday's familiar script, popping toward 0.5850 after the soft core reading in the US Consumer Price Index (CPI) report before surrendering the entire move as the latest war rhetoric out of Washington flipped the New York afternoon risk-averse, closing near 0.5800 beneath both of its key daily moving averages.
A central bank openly telling markets that rate hikes are coming should be a tailwind, but the Kiwi keeps demonstrating the difference between hikes that are promised and carry that actually pays.
A promise the market will not pay for
The Reserve Bank of New Zealand (RBNZ) held its cash rate at 2.25% in late May, the lowest setting since 2022 after more than 300 basis points of cuts, and then told markets in unusually plain language that increases will likely be required this year to stop near-term inflation from feeding medium-term expectations. Rate markets responded by pricing the better part of three quarter-point hikes by December, comfortably the steepest implied path among developed economies.
The arithmetic is the catch, since even the full track delivered without a stumble leaves the policy rate below the Federal Reserve (Fed) corridor of 3.50% to 3.75%, meaning the Kiwi's grand repricing buys it less-negative carry rather than any actual yield advantage. A reversal this sharp, from aggressive easing to hike guidance inside a single year, also reads less like confidence than like a central bank discovering it cut too far into an energy shock.
The wrong side of the same hemisphere
The geographic comparison is where the Kiwi's predicament gets genuinely unfair, because the same Strait of Hormuz disruption that fattens Australian export receipts lands in New Zealand as a fuel bill, and that bill grew on Wednesday as renewed US threats against Iran sent Crude Oil more than 2% higher. The country imports its energy and sells the world dairy, a basket that does not ride the Crude Oil complex, so the shock arrives as textbook imported inflation against a soft domestic pulse: Q1 CPI printed 3.1% YoY at the very top of the target band, while the manufacturing Purchasing Managers Index (PMI) sits barely above water at 50.5 and the services-sector Performance of Services Index (PSI) is contracting at 48.9.
The trans-Tasman gap is now brutal, with the Reserve Bank of Australia (RBA) cash rate a full two points above New Zealand's, and Wednesday added the sour footnote that when Chinese demand data wobbles, both antipodeans fall together anyway, with the Kiwi falling on less yield cushion and less excuse.
A GDP print hiding behind the Fed
The domestic docket stays nearly empty right up until the moment it becomes overwhelming. This week offers only Thursday's PMI update at 22:30 GMT, with the services reading following Sunday, and then next Wednesday delivers Q1 Gross Domestic Product (GDP) at 22:45 GMT, less than five hours after the Fed decision at 18:00 GMT and barely four after the press conference ends.
The previous quarter managed just 0.2% growth, and this print either gives the RBNZ's hike guidance an economy to stand on or exposes it as hope dressed up as forward guidance, in the least liquid hours of the trading day with the market still digesting the Fed. Positioning into that sequencing is closer to a coin toss than a trade.
Levels and bias
Resistance: The cluster formed by the 50-day and 200-day Exponential Moving Averages (EMA) between 0.5850 and 0.5900 turned Wednesday's bounce away before it even arrived, and beyond it the 0.5900 level guards the top of the June range.
Support: The area around 0.5750 comes first, with the spring base just under 0.5700 the bigger line in the sand.
Bias: Skeptical of rallies into next week. The Kiwi needs either a Fed stumble or a domestic growth surprise to escape the bottom of its 2026 range, and this week's calendar offers neither.
NZD/USD 5-minute chart
New Zealand Dollar FAQs
The New Zealand Dollar (NZD), also known as the Kiwi, is a well-known traded currency among investors. Its value is broadly determined by the health of the New Zealand economy and the country’s central bank policy. Still, there are some unique particularities that also can make NZD move. The performance of the Chinese economy tends to move the Kiwi because China is New Zealand’s biggest trading partner. Bad news for the Chinese economy likely means less New Zealand exports to the country, hitting the economy and thus its currency. Another factor moving NZD is dairy prices as the dairy industry is New Zealand’s main export. High dairy prices boost export income, contributing positively to the economy and thus to the NZD.
The Reserve Bank of New Zealand (RBNZ) aims to achieve and maintain an inflation rate between 1% and 3% over the medium term, with a focus to keep it near the 2% mid-point. To this end, the bank sets an appropriate level of interest rates. When inflation is too high, the RBNZ will increase interest rates to cool the economy, but the move will also make bond yields higher, increasing investors’ appeal to invest in the country and thus boosting NZD. On the contrary, lower interest rates tend to weaken NZD. The so-called rate differential, or how rates in New Zealand are or are expected to be compared to the ones set by the US Federal Reserve, can also play a key role in moving the NZD/USD pair.
Macroeconomic data releases in New Zealand are key to assess the state of the economy and can impact the New Zealand Dollar’s (NZD) valuation. A strong economy, based on high economic growth, low unemployment and high confidence is good for NZD. High economic growth attracts foreign investment and may encourage the Reserve Bank of New Zealand to increase interest rates, if this economic strength comes together with elevated inflation. Conversely, if economic data is weak, NZD is likely to depreciate.
The New Zealand Dollar (NZD) tends to strengthen during risk-on periods, or when investors perceive that broader market risks are low and are optimistic about growth. This tends to lead to a more favorable outlook for commodities and so-called ‘commodity currencies’ such as the Kiwi. Conversely, NZD tends to weaken at times of market turbulence or economic uncertainty as investors tend to sell higher-risk assets and flee to the more-stable safe havens.

Lebih dari satu juta pengguna mengandalkan FXStreet untuk data pasar real-time, alat charting, wawasan ahli, dan berita forex. Kalender ekonomi komprehensif dan webinar edukatif membantu trader tetap mendapat informasi dan membuat keputusan terukur. FXStreet memiliki sekitar 60 profesional yang tersebar antara kantor pusat Barcelona dan berbagai wilayah global.
Baca Selengkapnya


