
Polkadot Price Forecast: Bearish signals point to deeper correction
Oleh Manish Chhetri
Diperbarui: 25 Mar 2026


ARTIKEL POPULER

Polkadot (DOT) price extends its losses, slipping below $1.40 as of writing on Wednesday after falling slightly the previous day. Weakening derivatives metrics, alongside increasing bearish technical indicators, support a deeper correction for DOT in the near term.
- Polkadot price extends losses on Wednesday after falling slightly the previous day.
- Derivatives data support a bearish outlook with negative funding rates and rising short bets among traders.
- Momentum indicators show bearish strength gaining traction, hinting at a deeper correction ahead.
Polkadot (DOT) price extends its losses, slipping below $1.40 as of writing on Wednesday after falling slightly the previous day. Weakening derivatives metrics, alongside increasing bearish technical indicators, support a deeper correction for DOT in the near term.
DOT weakening derivatives metrics
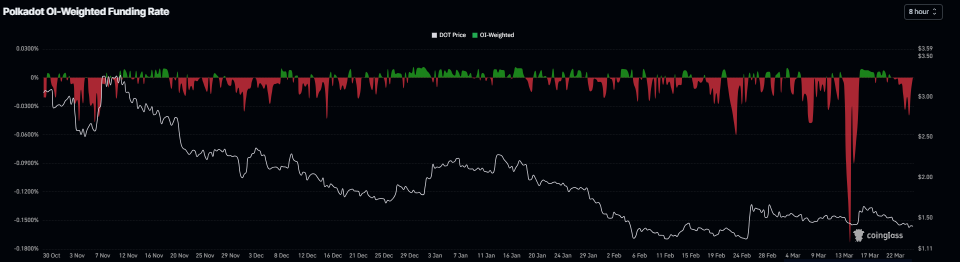
CoinGlass funding rates data support negative sentiment for Polkadot. The metric flipped to a negative rate on Saturday and has been falling sharply, to -0.019% on Wednesday, indicating shorts are paying longs and suggesting bearish sentiment toward DOT.
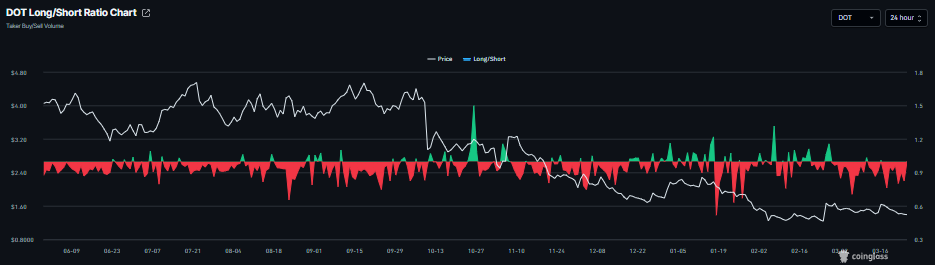
In addition, CoinGlass’s DOT long-to-short ratio is currently at 0.82 on Wednesday. This ratio, below one, reflects bearish sentiment in the markets, as more traders are betting on the asset price to fall.
Other signs of a negative outlook
Santiment’s Social Dominance metric for Polkadot also supports a bearish outlook. The index measures the share of DOT-related discussions across the cryptocurrency media. It has been in a downtrend since mid-March, reading 0.044% on Wednesday. This fall indicates fading market interest and sentiment among DOT investors.
 [10-1774421888557-1774421888558.59.14, 25 Mar, 2026].png)
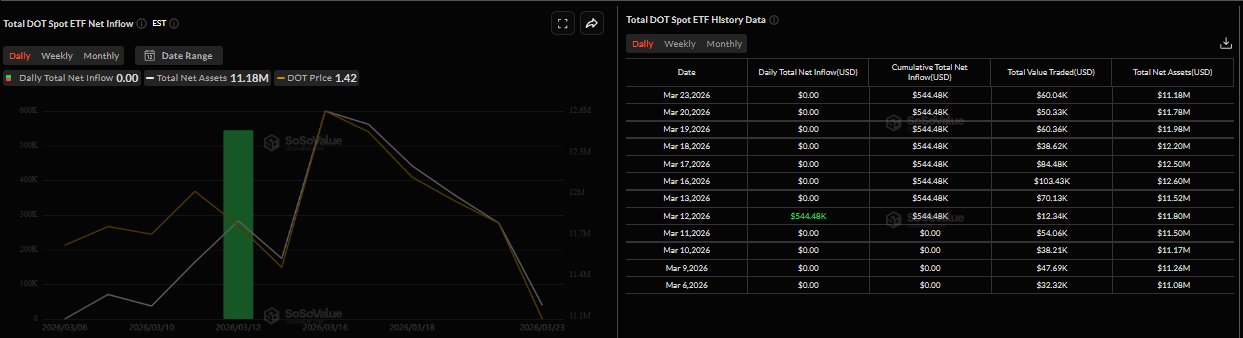
Looking at the institutional side, sentiment remains weak. The first spot Polkadot Exchange Traded Fund (ETF) launched by crypto asset manager 21Shares have seen no further inflows since the initial $544,490 intake on March 12, indicating a lack of institutional demand.
Polkadot Price Forecast: DOT hinting at deeper correction
DOT price is slipping below $1.40 as of Wednesday. The near-term bias is mildly bearish as price holds below the 50-day and 100-day Exponential Moving Averages near $1.53 and $1.75, respectively, both of which slope lower and cap rebounds.
The Relative Strength Index (RSI) on the daily chart at 42 stays below the 50 midline, indicating prevailing downside momentum rather than oversold exhaustion. The Moving Average Convergence Divergence (MACD) indicator turned negative, with the MACD line below the signal line and a contracting but still negative histogram, reinforcing fading bullish pressure after the recent bounce stalled beneath nearby resistance.
Immediate resistance stands at $1.53, its 50-day EMA, aligning with the 23.6% Fibonacci retracement of the downswing from $4.43 to $0.63 and sitting just under the horizontal barrier at $1.67. A daily close above $1.53 would open the way toward $1.67, where a cluster of prior supply is likely to impede advances.
On the downside, initial horizontal support is at $1.22; a break below exposes the lower zone toward $1.00, a psychological level, ahead of deeper Fibonacci support near the $0.63 swing low. As long as DOT trades beneath $1.53, rallies are vulnerable to renewed selling into resistance.
-1774422020298-1774422020299.png)
(The technical analysis of this story was written with the help of an AI tool.)

Lebih dari satu juta pengguna mengandalkan FXStreet untuk data pasar real-time, alat charting, wawasan ahli, dan berita forex. Kalender ekonomi komprehensif dan webinar edukatif membantu trader tetap mendapat informasi dan membuat keputusan terukur. FXStreet memiliki sekitar 60 profesional yang tersebar antara kantor pusat Barcelona dan berbagai wilayah global.
Baca Selengkapnya


