
Silver declines as Fed keeps interest rates steady, yields and USD strengthen
Oleh Vishal Chaturvedi
Diperbarui: 29 Apr 2026


ARTIKEL POPULER

Silver (XAG/USD) remains under pressure on Wednesday as markets digest the latest interest rate decision from the Federal Reserve (Fed), with a stronger US Dollar and rising US Treasury yields weighing on the non-yielding metal.
- Silver extends losses as Fed holds rates and signals cautious, data-dependent stance.
- Stronger US Dollar and rising Treasury yields weigh on the non-yielding metal.
- Technically, XAG/USD holds a bearish near-term bias, with momentum indicators pointing to fading upside momentum.
Silver (XAG/USD) remains under pressure on Wednesday as markets digest the latest interest rate decision from the Federal Reserve (Fed), with a stronger US Dollar and rising US Treasury yields weighing on the non-yielding metal. At the time of writing, XAG/USD is trading around $71.20, down more than 2% on the day.
The Fed left its benchmark rate unchanged in the 3.50%-3.75% range, in line with expectations. However, the decision revealed a notable split within the committee, with an 8-4 vote. Governor Stephen Miran favored a 25 basis point rate cut, while Beth Hammack, Neel Kashkari and Lorie Logan opposed the inclusion of any easing bias in the statement.
In its statement, the central bank acknowledged that economic activity continues to expand at a solid pace, while labor market conditions remain relatively stable, with the Unemployment Rate little changed in recent months. At the same time, policymakers flagged that inflation remains elevated, partly reflecting higher global energy prices.
The central bank also highlighted geopolitical risks, noting that developments in the Middle East are adding to uncertainty around the economic outlook.
Despite these concerns, policymakers reiterated that they remain strongly committed to supporting maximum employment and bringing inflation back to the 2% target over time, signaling that the current policy stance is likely to remain in place until clearer progress on inflation is seen.
For Silver, the combination of persistent inflation and rising energy prices is reinforcing expectations that interest rates could stay higher for longer. This backdrop remains a headwind for the non-yielding metal, as higher borrowing costs lift the opportunity cost of holding Silver.
Technical Analysis:
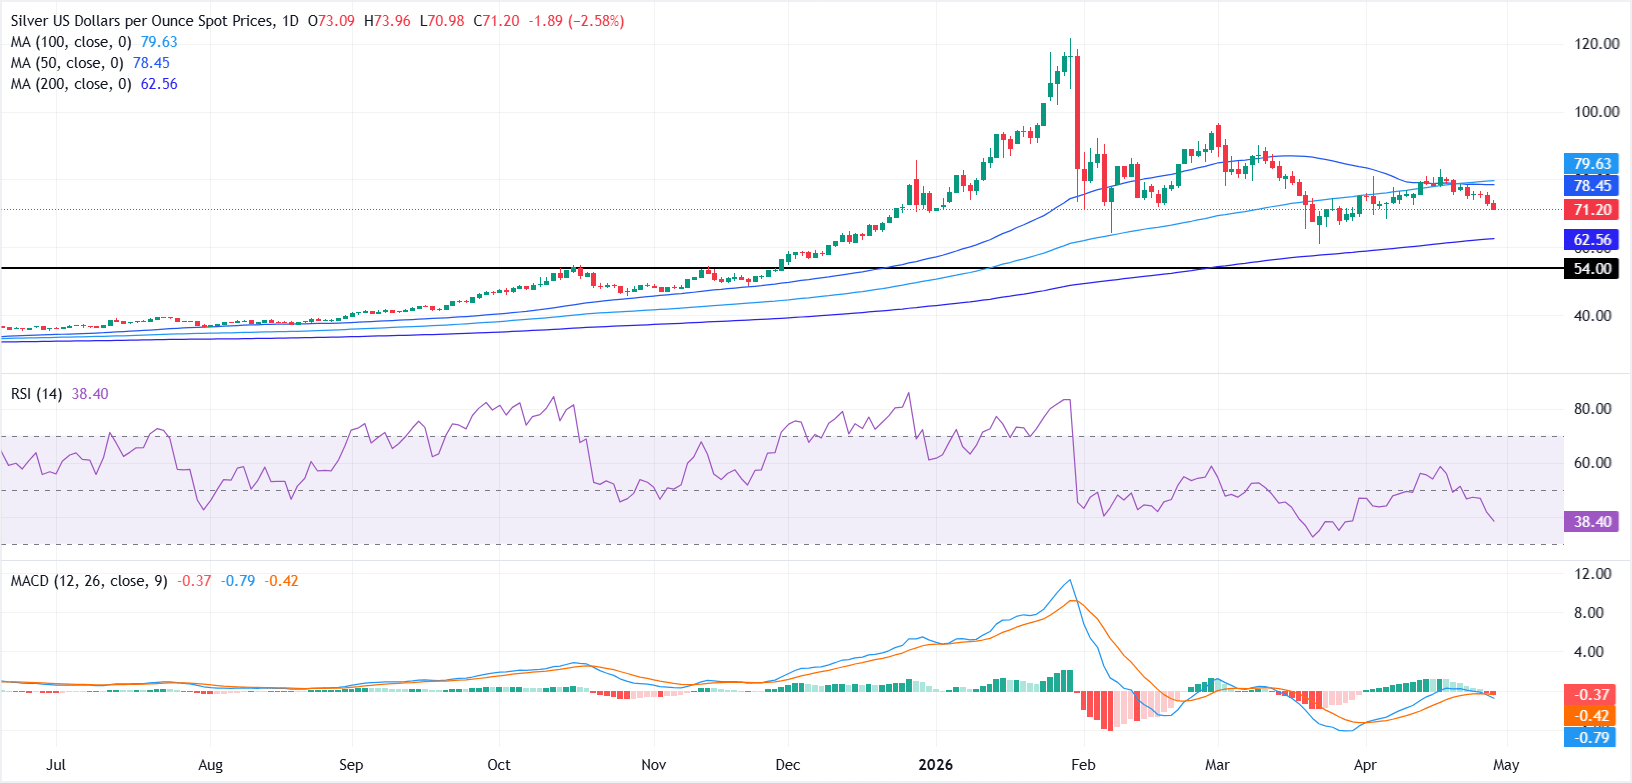
In the daily chart, XAG/USD remains under a bearish near-term bias as it holds below the 50-day Simple Moving Average (SMA) at $78.45 and the 100-day SMA at $79.63, while trading above the 200-day SMA at $62.56. This configuration suggests a corrective phase within a broader uptrend, with price capped by medium-term averages.
The Relative Strength Index (14) slipping toward 38 and the Moving Average Convergence Divergence (MACD) below zero with a negative reading both hint at fading upside momentum and a risk of further downside pressure while these overhead barriers remain intact.
On the downside, initial support is seen near the long-term 200-day SMA at $62.56, ahead of the horizontal support level at $54.00, which marks a deeper structural floor if selling accelerates.
On the topside, immediate resistance comes at the 50-day SMA at $78.45, followed by the 100-day SMA at $79.63; a sustained break above this clustered area would be needed to ease the current bearish tone and open the way for a renewed advance.
(The technical analysis of this story was written with the help of an AI tool.)
WTI Oil FAQs
WTI Oil is a type of Crude Oil sold on international markets. The WTI stands for West Texas Intermediate, one of three major types including Brent and Dubai Crude. WTI is also referred to as “light” and “sweet” because of its relatively low gravity and sulfur content respectively. It is considered a high quality Oil that is easily refined. It is sourced in the United States and distributed via the Cushing hub, which is considered “The Pipeline Crossroads of the World”. It is a benchmark for the Oil market and WTI price is frequently quoted in the media.
Like all assets, supply and demand are the key drivers of WTI Oil price. As such, global growth can be a driver of increased demand and vice versa for weak global growth. Political instability, wars, and sanctions can disrupt supply and impact prices. The decisions of OPEC, a group of major Oil-producing countries, is another key driver of price. The value of the US Dollar influences the price of WTI Crude Oil, since Oil is predominantly traded in US Dollars, thus a weaker US Dollar can make Oil more affordable and vice versa.
The weekly Oil inventory reports published by the American Petroleum Institute (API) and the Energy Information Agency (EIA) impact the price of WTI Oil. Changes in inventories reflect fluctuating supply and demand. If the data shows a drop in inventories it can indicate increased demand, pushing up Oil price. Higher inventories can reflect increased supply, pushing down prices. API’s report is published every Tuesday and EIA’s the day after. Their results are usually similar, falling within 1% of each other 75% of the time. The EIA data is considered more reliable, since it is a government agency.
OPEC (Organization of the Petroleum Exporting Countries) is a group of 12 Oil-producing nations who collectively decide production quotas for member countries at twice-yearly meetings. Their decisions often impact WTI Oil prices. When OPEC decides to lower quotas, it can tighten supply, pushing up Oil prices. When OPEC increases production, it has the opposite effect. OPEC+ refers to an expanded group that includes ten extra non-OPEC members, the most notable of which is Russia.

Lebih dari satu juta pengguna mengandalkan FXStreet untuk data pasar real-time, alat charting, wawasan ahli, dan berita forex. Kalender ekonomi komprehensif dan webinar edukatif membantu trader tetap mendapat informasi dan membuat keputusan terukur. FXStreet memiliki sekitar 60 profesional yang tersebar antara kantor pusat Barcelona dan berbagai wilayah global.
Baca Selengkapnya


