
Silver pauses recovery as US-Iran ceasefire optimism fades
Oleh Vishal Chaturvedi
Diperbarui: 25 Mar 2026


ARTIKEL POPULER

Silver (XAG/USD) pauses its intraday advance on Wednesday, consolidating below the daily high as initial optimism around US-Iran ceasefire efforts fades following Iran’s response.
- Silver steadies after rebound as US-Iran ceasefire optimism fades.
- Iran pushes back against US proposal, keeping geopolitical uncertainty elevated.
- Technically, XAG/USD remains under pressure despite recent stabilization.
Silver (XAG/USD) pauses its intraday advance on Wednesday, consolidating below the daily high as initial optimism around US-Iran ceasefire efforts fades following Iran’s response. At the time of writing, XAG/USD is around $72.74, up about 2% on the day, attempting a recovery after falling to its lowest level since December 2025 near $61 earlier this week.
The white metal rose sharply after reports that the United States had sent Iran a 15-point plan aimed at ending the conflict, which lifted market sentiment and temporarily reduced geopolitical risk premium embedded in Oil prices. This helped ease immediate inflation concerns, reducing pressure on global central banks to raise interest rates and supporting the non-yielding metal.
However, the move proved short-lived after Iran pushed back against the proposal. State-linked media Press TV reported on Wednesday that Tehran will end the conflict strictly on its own terms.
Iran has outlined clear conditions for any agreement, including a full stop to attacks and assassinations, guarantees that the war will not restart, compensation for war damages, an end to fighting across all regional fronts, and recognition of its control over the Strait of Hormuz.
The ongoing uncertainty and lack of a clear resolution continue to support demand for the US Dollar (USD), while elevated Oil prices are keeping inflation risks alive. This backdrop is limiting follow-through buying in Silver even as bargain hunting emerges after a steep sell-off.
XAG/USD technical analysis
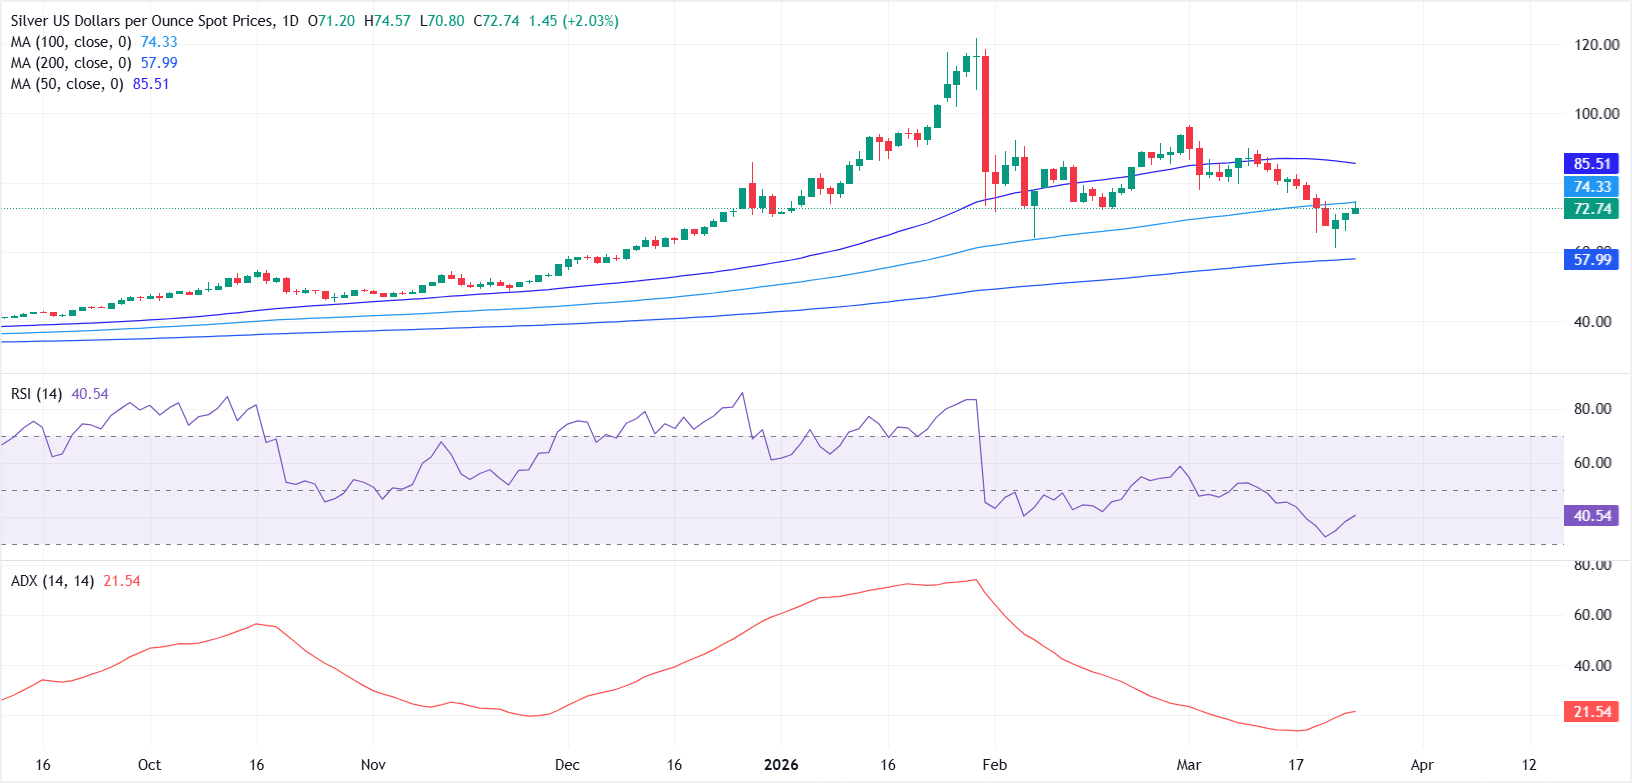
From a technical perspective, the daily chart shows XAG/USD’s near-term outlook as neutral to mildly bearish after nearing the 200-day Simple Moving Average (SMA). Prices remain below the 50-day SMA at $85.51 and the 100-day SMA at $74.33, with the latter capping immediate upside attempts.
The Relative Strength Index (RSI) at 40 points to subdued momentum and keeps downside pressure in focus, while the Average Directional Index (ADX) in the low 20s shows a weakening trend phase rather than an aggressive directional move.
On the upside, a decisive break above the 100-day SMA would help ease downside pressure, with the $80 psychological level coming into focus. A move above this could open the door toward the 50-day SMA, with a sustained break above it signaling a return to the prevailing uptrend.
On the downside, immediate support is seen at Tuesday’s low near $66.01, followed by Monday’s low around $61.01. A break below these levels would expose the 200-day SMA at $57.99. If the 200-day SMA fails to hold, a deeper corrective move could unfold.
Silver FAQs
Silver is a precious metal highly traded among investors. It has been historically used as a store of value and a medium of exchange. Although less popular than Gold, traders may turn to Silver to diversify their investment portfolio, for its intrinsic value or as a potential hedge during high-inflation periods. Investors can buy physical Silver, in coins or in bars, or trade it through vehicles such as Exchange Traded Funds, which track its price on international markets.
Silver prices can move due to a wide range of factors. Geopolitical instability or fears of a deep recession can make Silver price escalate due to its safe-haven status, although to a lesser extent than Gold's. As a yieldless asset, Silver tends to rise with lower interest rates. Its moves also depend on how the US Dollar (USD) behaves as the asset is priced in dollars (XAG/USD). A strong Dollar tends to keep the price of Silver at bay, whereas a weaker Dollar is likely to propel prices up. Other factors such as investment demand, mining supply – Silver is much more abundant than Gold – and recycling rates can also affect prices.
Silver is widely used in industry, particularly in sectors such as electronics or solar energy, as it has one of the highest electric conductivity of all metals – more than Copper and Gold. A surge in demand can increase prices, while a decline tends to lower them. Dynamics in the US, Chinese and Indian economies can also contribute to price swings: for the US and particularly China, their big industrial sectors use Silver in various processes; in India, consumers’ demand for the precious metal for jewellery also plays a key role in setting prices.
Silver prices tend to follow Gold's moves. When Gold prices rise, Silver typically follows suit, as their status as safe-haven assets is similar. The Gold/Silver ratio, which shows the number of ounces of Silver needed to equal the value of one ounce of Gold, may help to determine the relative valuation between both metals. Some investors may consider a high ratio as an indicator that Silver is undervalued, or Gold is overvalued. On the contrary, a low ratio might suggest that Gold is undervalued relative to Silver.

Lebih dari satu juta pengguna mengandalkan FXStreet untuk data pasar real-time, alat charting, wawasan ahli, dan berita forex. Kalender ekonomi komprehensif dan webinar edukatif membantu trader tetap mendapat informasi dan membuat keputusan terukur. FXStreet memiliki sekitar 60 profesional yang tersebar antara kantor pusat Barcelona dan berbagai wilayah global.
Baca Selengkapnya


