
Top 3 Price Prediction: Bitcoin, Ethereum, Ripple – BTC eyes $65,000, ETH risks $1,800, XRP holds at $1.20
Oleh Vishal Dixit
Diperbarui: 3 Jun 2026


ARTIKEL POPULER

Bitcoin (BTC), Ethereum (ETH), and Ripple (XRP) are catching a breath during early Asian trading hours on Wednesday after losing over 6% the previous day.
- Bitcoin hovers below $67,000 on Wednesday, steadying after a 6% loss the previous day.
- Ethereum stabilizes below $1,900, with buyers holding to a key support after a 7% loss the day before.
- XRP edges above the $1.20 psychological threshold after a three-day losing streak of roughly 10%.
Bitcoin (BTC), Ethereum (ETH), and Ripple (XRP) are catching a breath during early Asian trading hours on Wednesday after losing over 6% the previous day. The path of least resistance in Bitcoin and Ethereum points to further correction likely toward the $65,000 and $1,675, while XRP risks losing the $1.20 psychological support level.
Bitcoin eyes $65,000 amid a falling knife maneuver
Bitcoin trades at around $66,500, extending a bearish phase as it remains well below the reclaimed Exponential Moving Averages (EMAs) and the previously rising support trend line, which now acts as resistance. BTC sits below the 50-day EMA around $75,302, the 100-day EMA near $76,238, and the 200-day EMA near $82,128, underscoring a downward bias despite an already stretched decline.
Momentum remains weak on the daily chart, with the Relative Strength Index (RSI) hovering in oversold territory near 21 and the Moving Average Convergence Divergence (MACD) deep in negative territory, with its signal line, while negative histogram bars expand, which together suggest persistent downside pressure.
On the downside, Bitcoin could target the lows of March 29 and February 6 at $65,000 and $60,000, respectively, where buyers may attempt to regain control of the trend.
On the topside, initial resistance is seen at the former upward-sloping trend-line break level around $71,478, which now caps recovery attempts. A sustained move above that area would next target the 50-day EMA near $75,302 and the 100-day EMA near $76,238, while the 200-day EMA at $82,128 serves as a broader bearish pivot higher up.
Ethereum risks losing $1,800 as selling pressure mounts
Ethereum maintains a bearish bias after a 7% drop on Tuesday, with price hovering above the $1,835 near-term support level, marked by the February 28 low. A decisive close below this level extends the fast-paced correction in Ethereum toward the February 6 low at $1,747.
Momentum oscillators reinforce the weak tone, with the RSI hovering near oversold territory at around 22 and the MACD remaining in negative territory, suggesting persistent downside pressure despite intermittent corrective bounces.
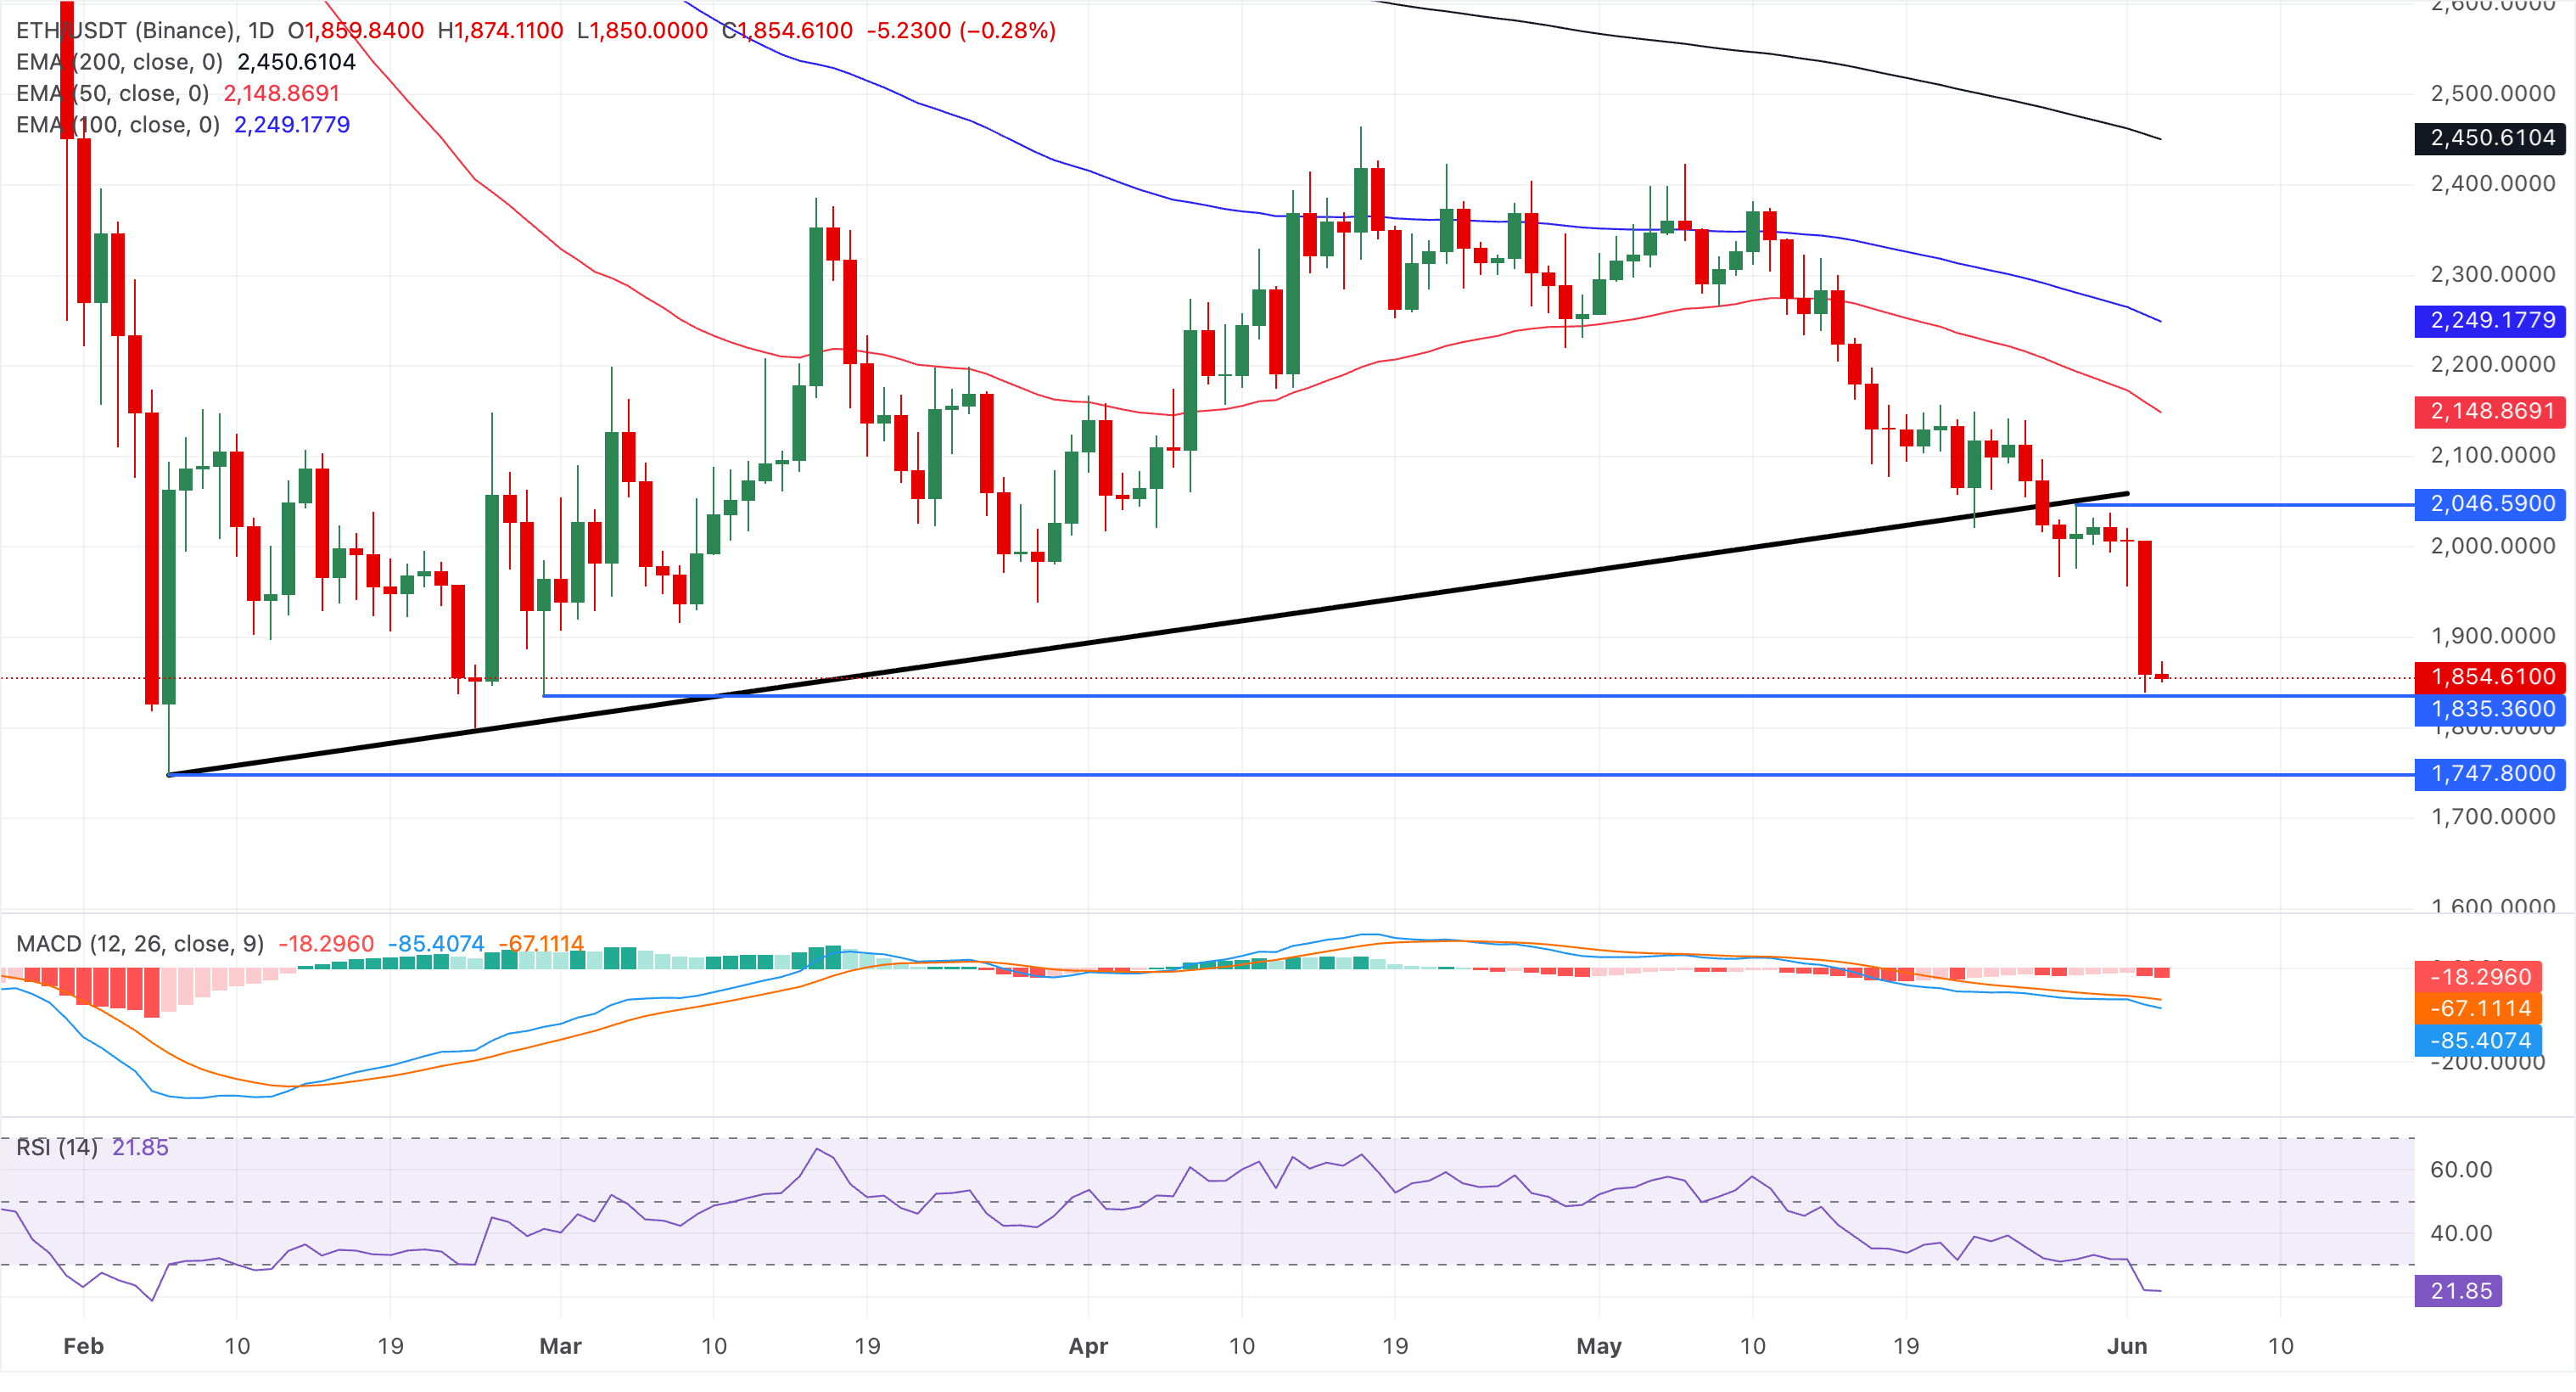
On the topside, initial resistance emerges at the broken ascending trend-line area around $2,065, which now acts as the first hurdle for any recovery attempt. A sustained break above that zone would expose the 50-day EMA at roughly $2,148, the 100-day EMA near $2,249, and the 200-day EMA around $2,450, which now sit overhead as a stacked resistance band, underscoring a structurally capped market.
XRP price decline targets February low
Ripple is trading above $1.2200 at press time on Wednesday, but remains broadly bearish after the 6% drop the previous day. Similar to Bitcoin and Ethereum, XRP trades well below the 50-, 100-, and 200-day EMAs at roughly $1.3695, $1.4447, and $1.6431, respectively.
The RSI hovers just below the 30 mark, hinting at oversold conditions but not yet signaling a decisive rebound, while the MACD line remains in a clear downtrend below its signal line in the negative territory, reinforcing persistent downside momentum despite the stretched decline.
Immediate support for XRP below the $1.20 round figure lies at the February 6 low of $1.1179.
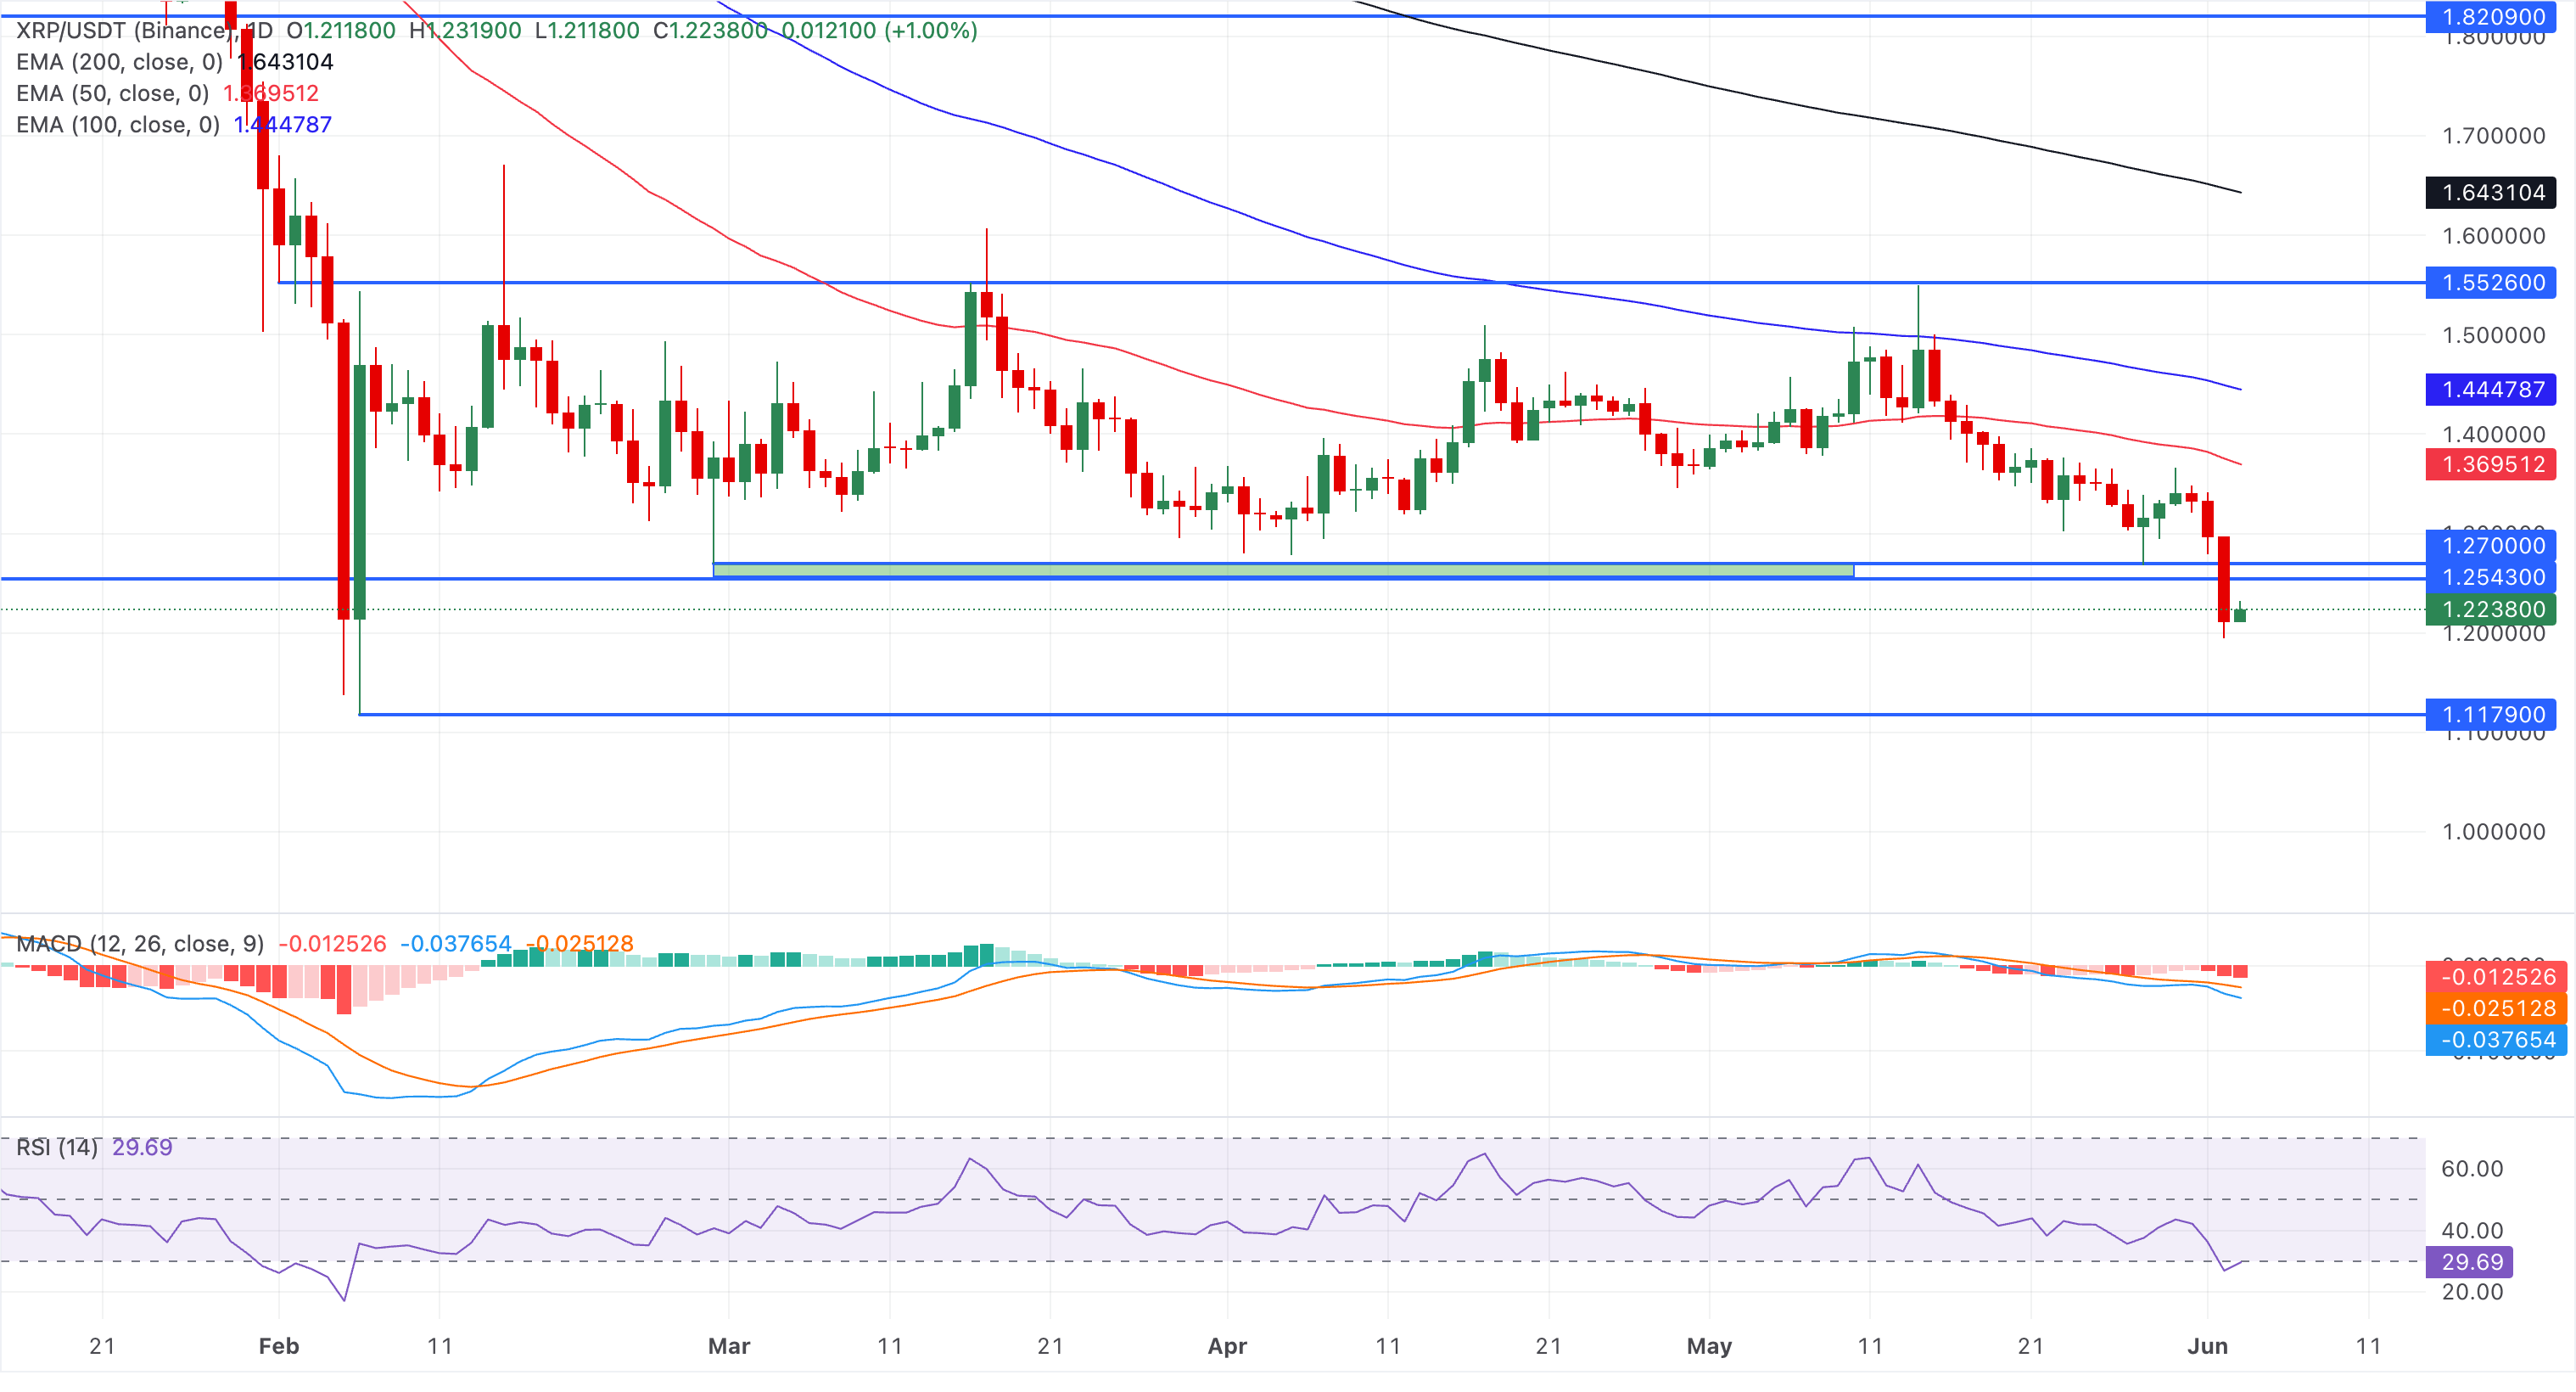
On the topside, initial resistance is seen at the 50-day EMA near 1.37, with further barriers at the 100-day EMA around 1.44 and the 200-day EMA near 1.64, levels that would need to be reclaimed to ease prevailing bearish pressure.
(The technical analysis of this story was written with the help of an AI tool.)
Bitcoin, altcoins, stablecoins FAQs
Bitcoin is the largest cryptocurrency by market capitalization, a virtual currency designed to serve as money. This form of payment cannot be controlled by any one person, group, or entity, which eliminates the need for third-party participation during financial transactions.
Altcoins are any cryptocurrency apart from Bitcoin, but some also regard Ethereum as a non-altcoin because it is from these two cryptocurrencies that forking happens. If this is true, then Litecoin is the first altcoin, forked from the Bitcoin protocol and, therefore, an “improved” version of it.
Stablecoins are cryptocurrencies designed to have a stable price, with their value backed by a reserve of the asset it represents. To achieve this, the value of any one stablecoin is pegged to a commodity or financial instrument, such as the US Dollar (USD), with its supply regulated by an algorithm or demand. The main goal of stablecoins is to provide an on/off-ramp for investors willing to trade and invest in cryptocurrencies. Stablecoins also allow investors to store value since cryptocurrencies, in general, are subject to volatility.
Bitcoin dominance is the ratio of Bitcoin's market capitalization to the total market capitalization of all cryptocurrencies combined. It provides a clear picture of Bitcoin’s interest among investors. A high BTC dominance typically happens before and during a bull run, in which investors resort to investing in relatively stable and high market capitalization cryptocurrency like Bitcoin. A drop in BTC dominance usually means that investors are moving their capital and/or profits to altcoins in a quest for higher returns, which usually triggers an explosion of altcoin rallies.

Lebih dari satu juta pengguna mengandalkan FXStreet untuk data pasar real-time, alat charting, wawasan ahli, dan berita forex. Kalender ekonomi komprehensif dan webinar edukatif membantu trader tetap mendapat informasi dan membuat keputusan terukur. FXStreet memiliki sekitar 60 profesional yang tersebar antara kantor pusat Barcelona dan berbagai wilayah global.
Baca Selengkapnya


