
USD/CHF Price Forecast: Bears gain momentum with 0.7930 support in focus
Oleh Guillermo Alcala
Diperbarui: 16 Jun 2026


ARTIKEL POPULER

The US Dollar (USD) posts marginal losses against the Swiss Franc (CHF) on Tuesday, with bears aiming for a key support area between 0.7900 and 0.7930.
- USD/CHF remains on the defensive, below 0.7050, with 0.7030 in the bears' focus.
- Hopes of a lasting peace in the Middle East are keeping the US Dollar's upside attempts limited.
- The pair approaches the neckline of a Head & Shoulders pattern.
The US Dollar (USD) posts marginal losses against the Swiss Franc (CHF) on Tuesday, with bears aiming for a key support area between 0.7900 and 0.7930. Moderate optimism about a US-Iran peace deal is keeping the USD’s rally subdued, while investors’ caution ahead of the Federal Reserve’s meeting is limiting dips for now.
US President Trump affirmed at the G7 summit that the deal with Tehran is going to a “second stage” and that Iran agreed never to have a nuclear weapon. Meanwhile, the UK newspaper Guardian, citing the Israeli Haaretz, affirms that the deal includes the release of $24 billion of frozen Iranian assets in exchange for allowing toll-free navigation in Hormuz.
Investors will have some distraction from the Middle East conflict on Wednesday, as the Federal Reserve (Fed) concludes its first monetary policy meeting under the leadership of Chairman Kevin Warsh. Warsh is expected to adopt a more dovish stance than his predecessor, Jerome Powell, and traders will have the interest rate and economic projection releases to contrast those views.
Technical Analysis: A bearish Head & Shoulders is in progress
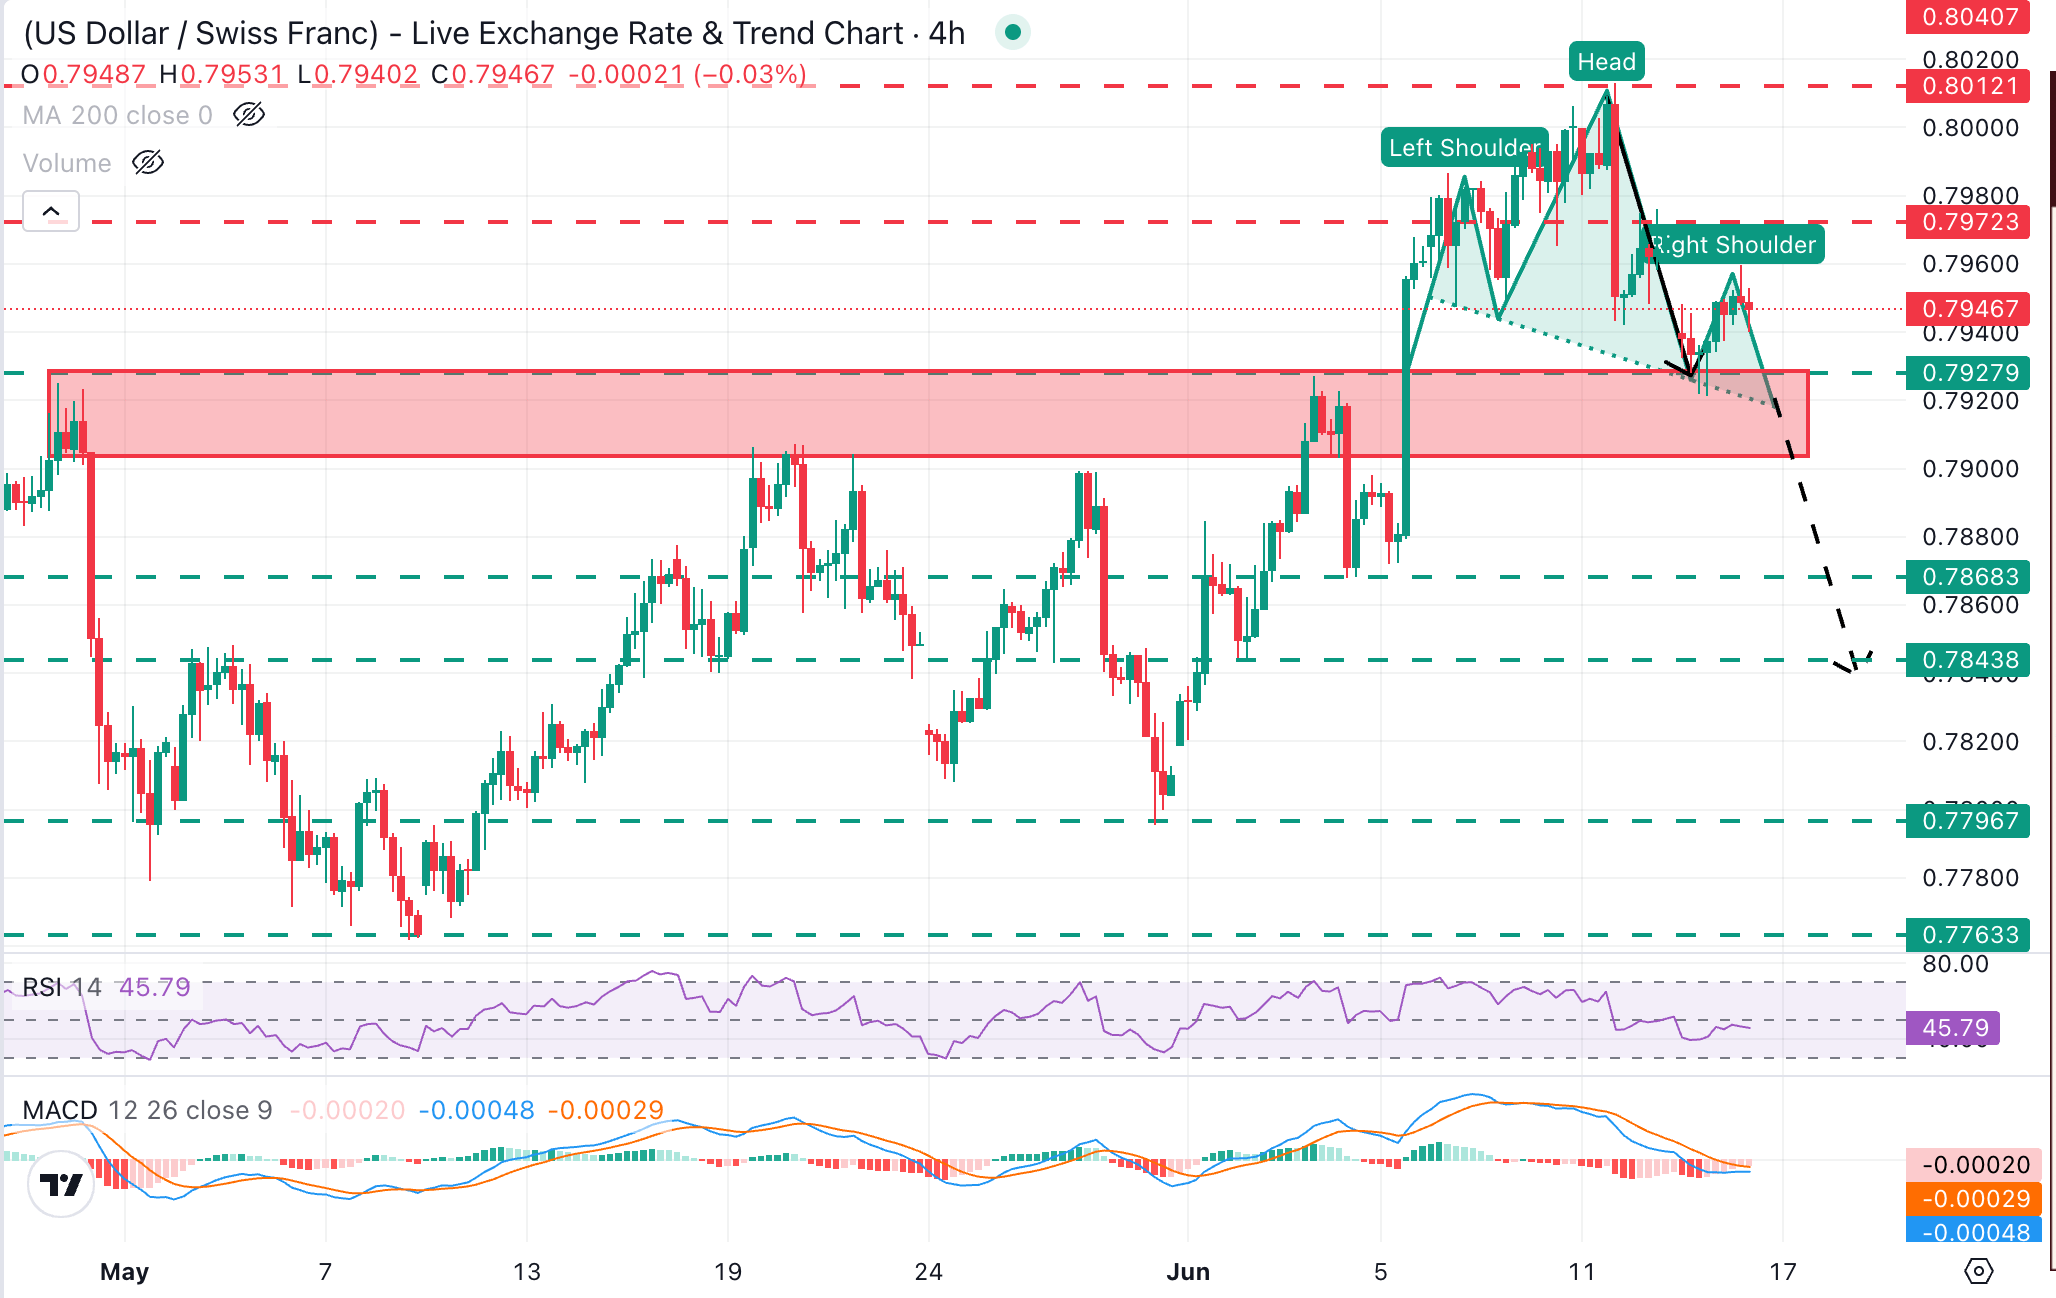
USD/CHF trades at 0.7946, keeping a mildly bearish near-term bias with recent price action showing a potential Head & Shoulders (H&S) pattern. The Relative Strength Index (RSI) has eased back toward the mid‑40s while the Moving Average Convergence Divergence (MACD) remains marginally negative, suggesting that upside attempts could continue to struggle unless momentum improves.
Bears are focusing on the 0.7930 area (Monday's low), the upper boundary of a previous resistance area, now turned support. Halfway through that area lies the neckline of the H&S pattern, now at 0.7915, while the lower boundary would be at the 0.7900 area (May 19, 20, 21, and 28 highs). Below there, the June 4 and 5 lows are around 0.6870. The H&S's measured target is at the June 2 low, near 0.7845
On the topside, immediate resistance is seen at the area between 0.7960 and 0.7970, Monday and Friday's lows, respectively. A confirmation above those levels negates this view and brings the June 11 high, at 0.8013, into play.
(The technical analysis of this story was written with the help of an AI tool.)
US Dollar Price Today
The table below shows the percentage change of US Dollar (USD) against listed major currencies today. US Dollar was the strongest against the Canadian Dollar.
| USD | EUR | GBP | JPY | CAD | AUD | NZD | CHF | |
|---|---|---|---|---|---|---|---|---|
| USD | -0.07% | 0.01% | 0.00% | 0.10% | 0.08% | -0.06% | 0.07% | |
| EUR | 0.07% | 0.08% | 0.09% | 0.18% | 0.13% | 0.01% | 0.14% | |
| GBP | -0.01% | -0.08% | 0.00% | 0.10% | 0.05% | -0.06% | 0.07% | |
| JPY | 0.00% | -0.09% | 0.00% | 0.08% | 0.05% | -0.06% | 0.08% | |
| CAD | -0.10% | -0.18% | -0.10% | -0.08% | -0.03% | -0.17% | -0.04% | |
| AUD | -0.08% | -0.13% | -0.05% | -0.05% | 0.03% | -0.11% | 0.02% | |
| NZD | 0.06% | -0.01% | 0.06% | 0.06% | 0.17% | 0.11% | 0.13% | |
| CHF | -0.07% | -0.14% | -0.07% | -0.08% | 0.04% | -0.02% | -0.13% |
The heat map shows percentage changes of major currencies against each other. The base currency is picked from the left column, while the quote currency is picked from the top row. For example, if you pick the US Dollar from the left column and move along the horizontal line to the Japanese Yen, the percentage change displayed in the box will represent USD (base)/JPY (quote).

Lebih dari satu juta pengguna mengandalkan FXStreet untuk data pasar real-time, alat charting, wawasan ahli, dan berita forex. Kalender ekonomi komprehensif dan webinar edukatif membantu trader tetap mendapat informasi dan membuat keputusan terukur. FXStreet memiliki sekitar 60 profesional yang tersebar antara kantor pusat Barcelona dan berbagai wilayah global.
Baca Selengkapnya


