
WTI Price Forecast: Rises to near $98.50 as bullish bias prevails
Oleh Akhtar Faruqui
Diperbarui: 15 May 2026


ARTIKEL POPULER

WTI extends its gains for the second consecutive day, trading around $98.20 during the Asian hours on Friday. The technical analysis of the daily chart indicates that the spot is remaining within the ascending triangle, suggesting that the primary trend is upward.
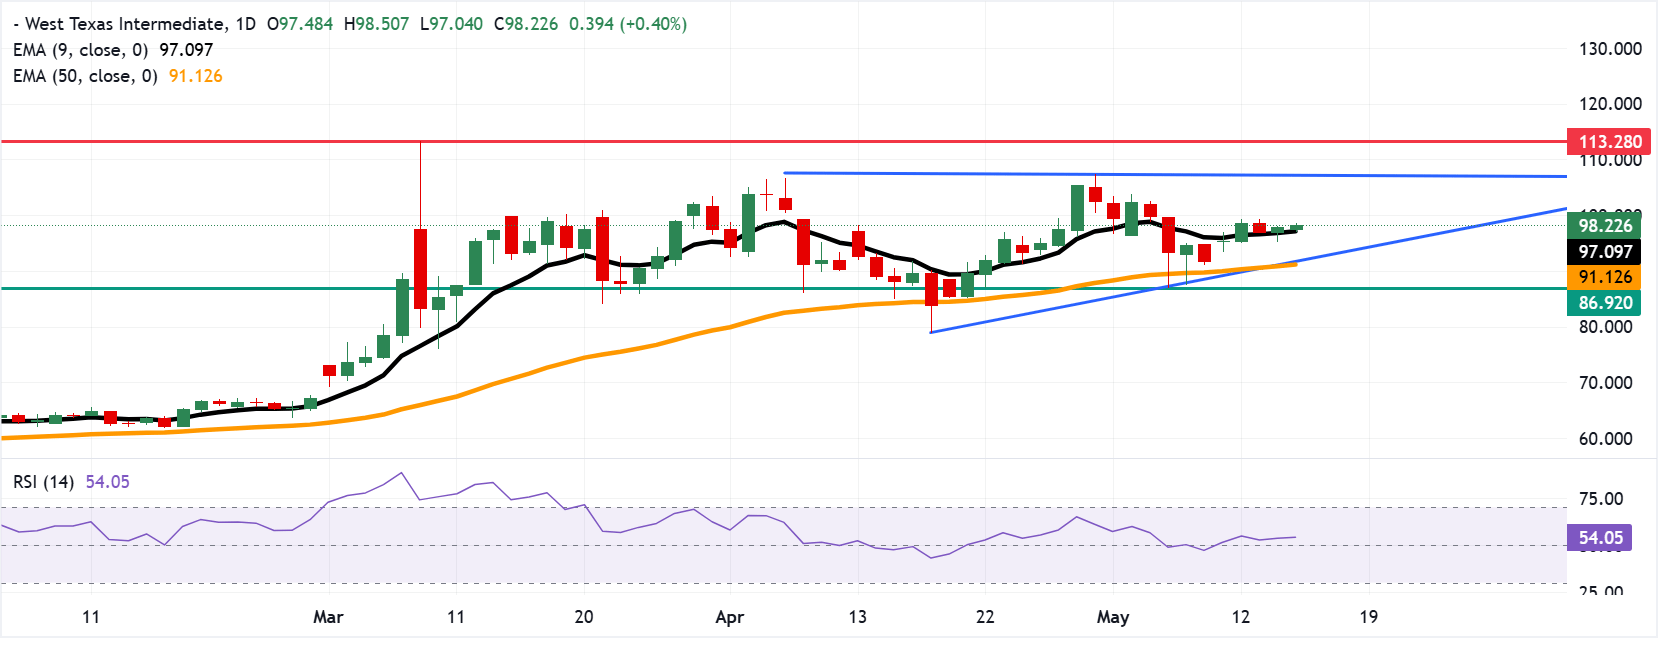
- WTI could test the key resistance level at the ascending triangle's upper boundary around $107.50.
- The 14-day Relative Strength Index is around 53.78, suggesting that upward momentum remains intact.
- The pair may test the primary support at the nine-day EMA at $97.06.
WTI extends its gains for the second consecutive day, trading around $98.20 during the Asian hours on Friday. The technical analysis of the daily chart indicates that the spot is remaining within the ascending triangle, suggesting that the primary trend is upward. Buyers are in control, stepping in at higher price points each time the asset dips.
WTI maintains a constructive bullish bias as it holds above both the short-term nine-day Exponential Moving Average (EMA) and the medium-term 50-day EMA. The alignment of price over these averages suggests a supportive trend structure, while the 14-day Relative Strength Index (RSI) around 53.78 remains in neutral territory, hinting that upside potential persists without immediate overbought stress.
The WTI pair may approach the primary barrier around the upper boundary of the ascending triangle at around the $107.50. A break above the triangle would support the oil price to test the $113.28, the highest since June 2022.
On the downside, the immediate support lies at the nine-day EMA of $97.06. A break below the short-term average would weaken the price momentum and put downward pressure on the WTI to test the lower ascending triangle boundary around $92.40, followed by the 50-day EMA at $91.12. Further declines would expose a nearly monthly low of $86.92, recorded on May 6.
(The technical analysis of this story was written with the help of an AI tool.)
WTI Oil FAQs
WTI Oil is a type of Crude Oil sold on international markets. The WTI stands for West Texas Intermediate, one of three major types including Brent and Dubai Crude. WTI is also referred to as “light” and “sweet” because of its relatively low gravity and sulfur content respectively. It is considered a high quality Oil that is easily refined. It is sourced in the United States and distributed via the Cushing hub, which is considered “The Pipeline Crossroads of the World”. It is a benchmark for the Oil market and WTI price is frequently quoted in the media.
Like all assets, supply and demand are the key drivers of WTI Oil price. As such, global growth can be a driver of increased demand and vice versa for weak global growth. Political instability, wars, and sanctions can disrupt supply and impact prices. The decisions of OPEC, a group of major Oil-producing countries, is another key driver of price. The value of the US Dollar influences the price of WTI Crude Oil, since Oil is predominantly traded in US Dollars, thus a weaker US Dollar can make Oil more affordable and vice versa.
The weekly Oil inventory reports published by the American Petroleum Institute (API) and the Energy Information Agency (EIA) impact the price of WTI Oil. Changes in inventories reflect fluctuating supply and demand. If the data shows a drop in inventories it can indicate increased demand, pushing up Oil price. Higher inventories can reflect increased supply, pushing down prices. API’s report is published every Tuesday and EIA’s the day after. Their results are usually similar, falling within 1% of each other 75% of the time. The EIA data is considered more reliable, since it is a government agency.
OPEC (Organization of the Petroleum Exporting Countries) is a group of 12 Oil-producing nations who collectively decide production quotas for member countries at twice-yearly meetings. Their decisions often impact WTI Oil prices. When OPEC decides to lower quotas, it can tighten supply, pushing up Oil prices. When OPEC increases production, it has the opposite effect. OPEC+ refers to an expanded group that includes ten extra non-OPEC members, the most notable of which is Russia.

Lebih dari satu juta pengguna mengandalkan FXStreet untuk data pasar real-time, alat charting, wawasan ahli, dan berita forex. Kalender ekonomi komprehensif dan webinar edukatif membantu trader tetap mendapat informasi dan membuat keputusan terukur. FXStreet memiliki sekitar 60 profesional yang tersebar antara kantor pusat Barcelona dan berbagai wilayah global.
Baca Selengkapnya


