
XRP and XLM outlook: Mixed sentiment keeps bulls cautious
Oleh Manish Chhetri
Diperbarui: 28 Apr 2026


ARTIKEL POPULER

Ripple (XRP) and Stellar (XLM) remain under pressure on Tuesday as mixed market sentiment keeps price action subdued. XRP extends its decline after slipping below a key technical support level, while XLM remains well below major resistance zones.
- Ripple extends losses on Tuesday after closing below key 50-day EMA level at $1.41, the previous day.
- XLM remains under pressure, with prices well below key levels.
- Momentum indicators for both altcoins show early signs of weakness, while derivatives data shows mixed sentiment, keeping a cautious outlook.
Ripple (XRP) and Stellar (XLM) remain under pressure on Tuesday as mixed market sentiment keeps price action subdued. XRP extends its decline after slipping below a key technical support level, while XLM remains well below major resistance zones. Traders should be cautious, as momentum indicators for both altcoins show early signs of weakness, while on-chain and derivatives data suggest mixed sentiment, signaling limited bullish conviction.
Mixed sentiment keeps upside limited
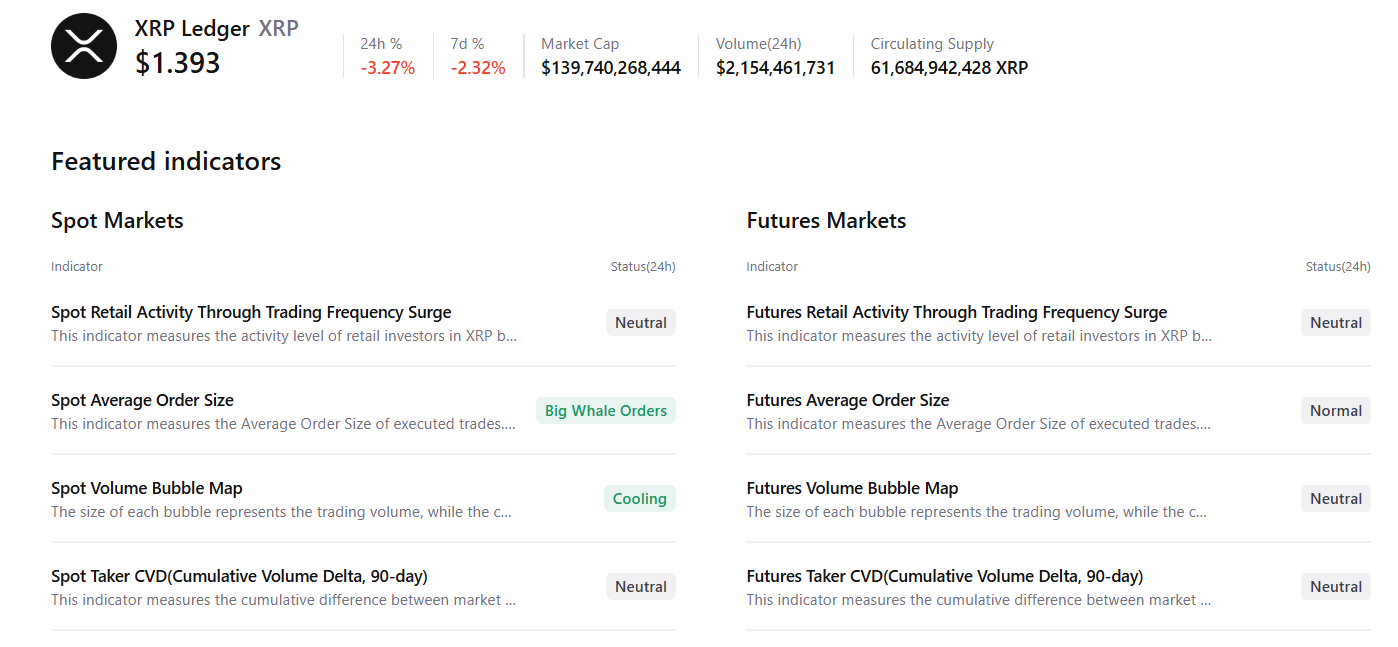
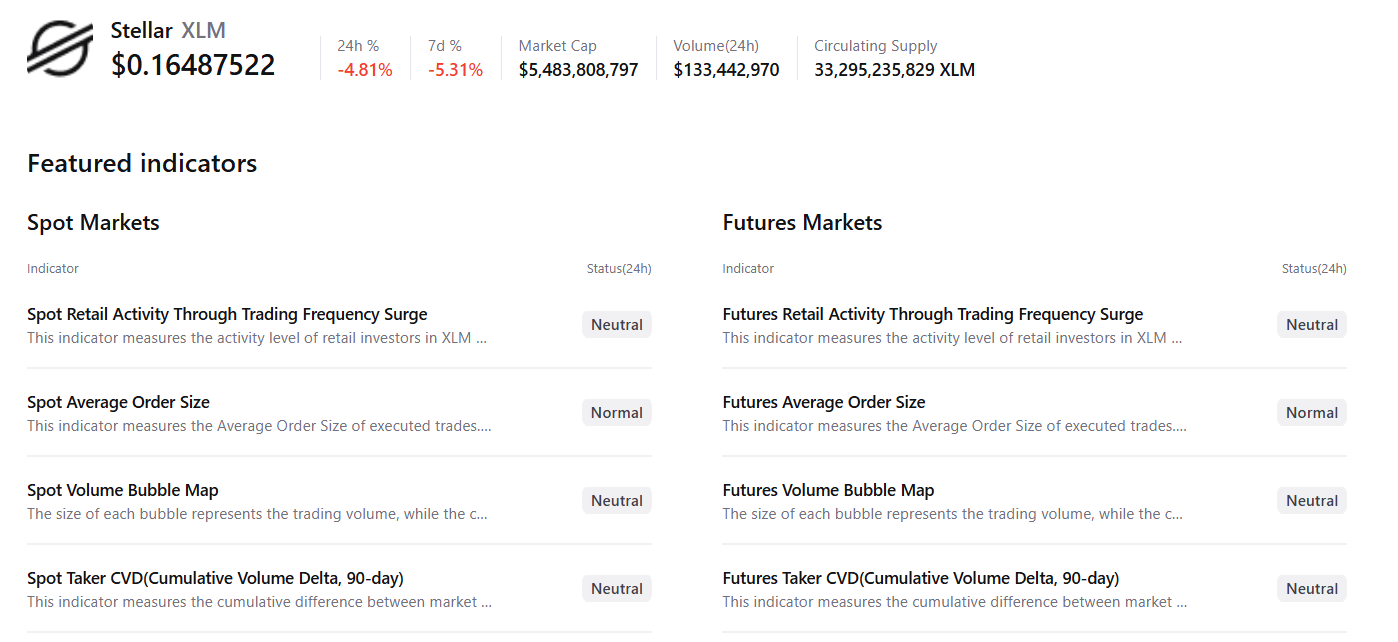
CryptoQuant summary data suggests a neutral to slightly bullish outlook for XRP and XLM.
XRP’s spot markets show large whale orders and cooling conditions, with mostly neutral conditions across other metrics, suggesting a potential upside move.
Meanwhile, for XLM, the data shows neutral conditions across other metrics, suggesting traders remain cautious and await stronger directional confirmation.
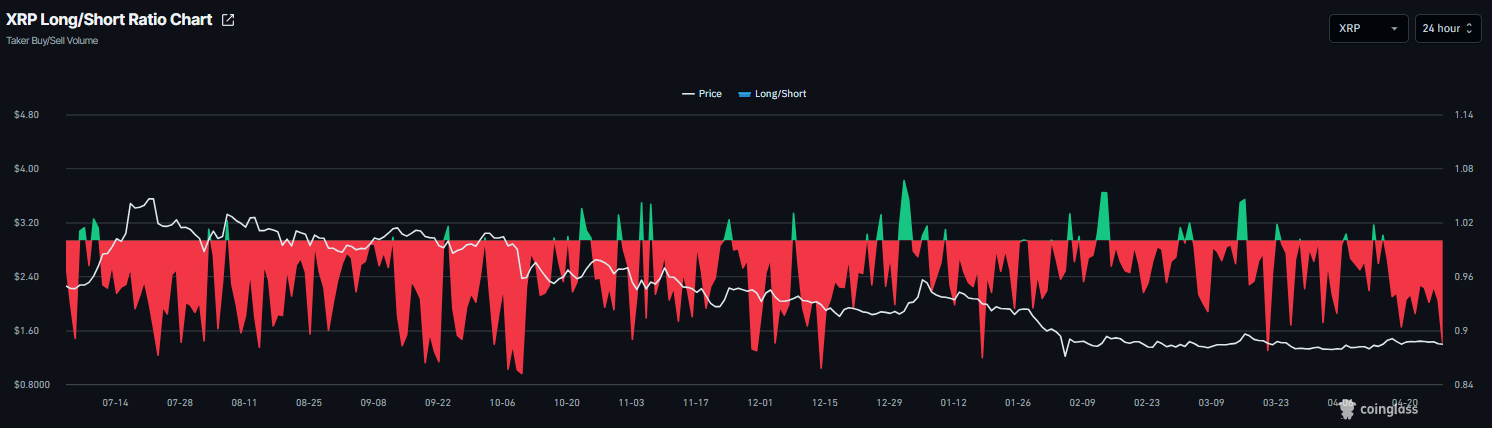
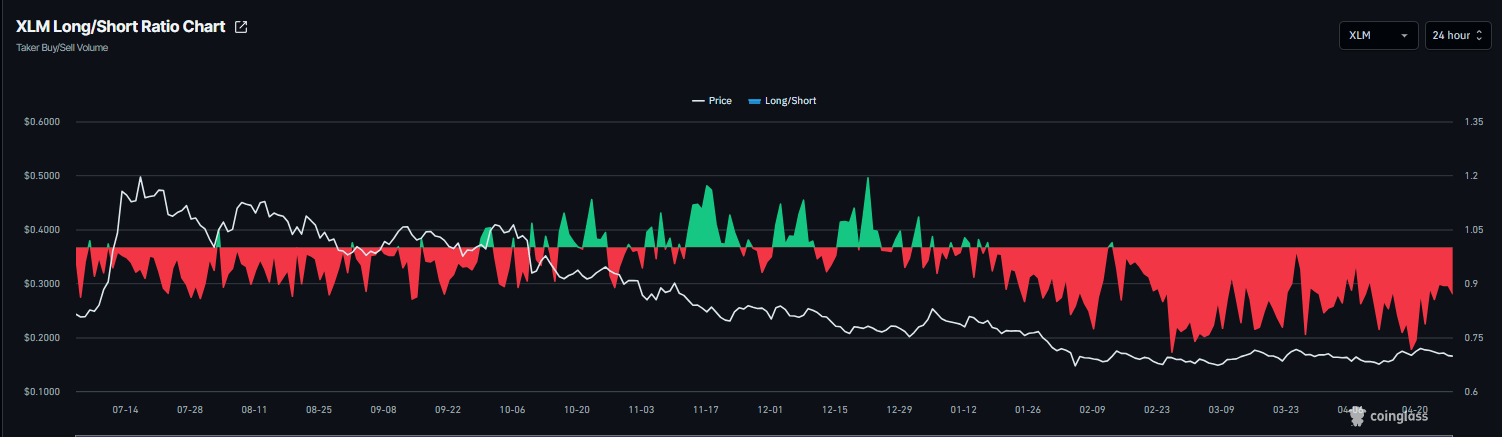
On the derivatives side, Ripple and Stellar data show mixed sentiment. CoinGlass’ long-to-short ratio for XRP and XLM reads 0.88 and 0.87, respectively, on Tuesday. This ratio, being below one, reflects bearish sentiment in the market, as more traders are betting on the asset’s price to fall.
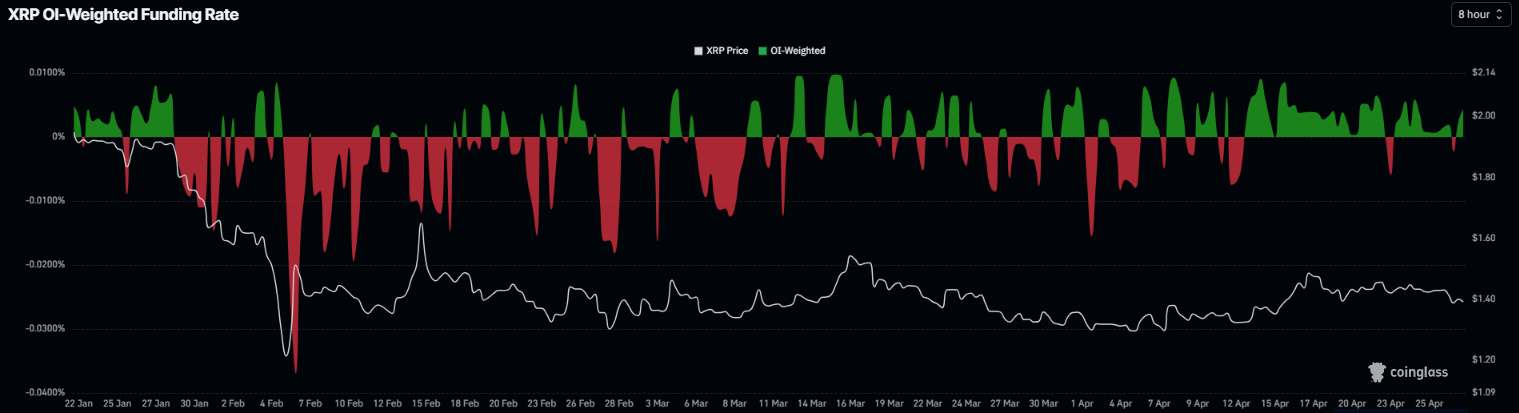
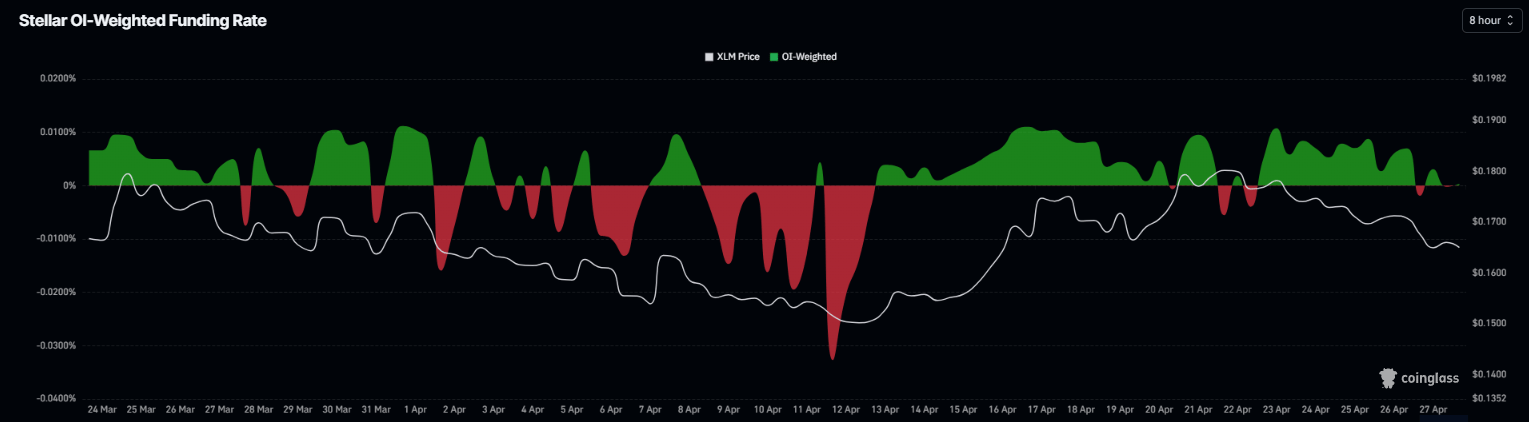
Meanwhile, the funding rates support improving sentiment. CoinGlass’ OI-Weighted Funding Rate data for XRP flipped positive on Monday, and Stellar flipped positive on Tuesday, reading 0.0044% and 0.0004%, respectively. This positive rate indicates that longs are paying shorts and projecting a bullish sentiment.
This combination suggests indecision among XRP and Stellar investors and a lack of clear directional bias, which limits the chances of a sustained recovery.
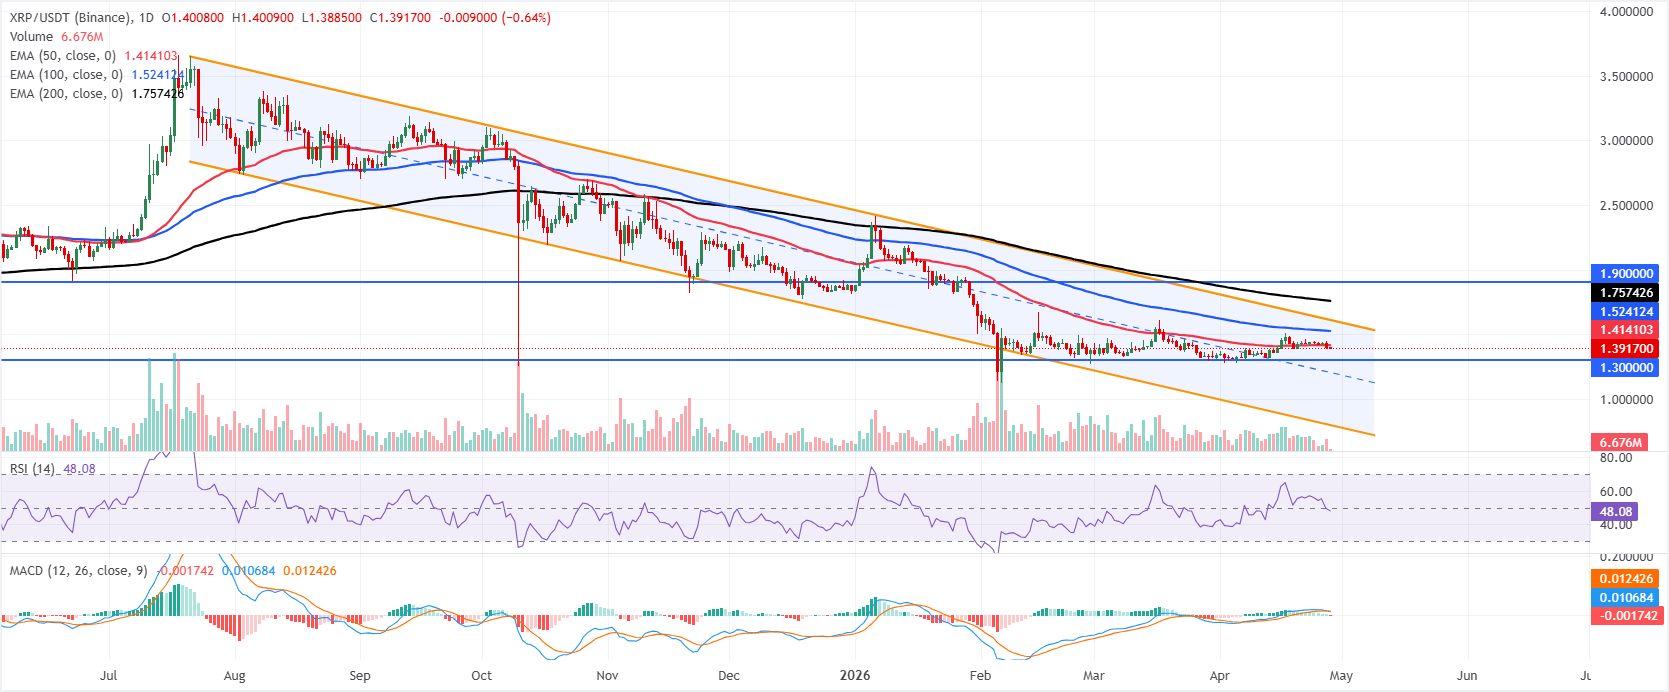
XRP technical outlook: Slides below key support
XRP price is trading below at $1.40, keeping a bearish bias as price holds below the 50-day Exponential Moving Average (EMA) at $1.41 and the 100-day EMA at $1.52, with the 200-day EMA further overhead at $1.75.
XRP remains confined within a broader downward parallel channel, with the upper boundary near $1.60 capping the medium-term outlook, while the Relative Strength Index (RSI) on the daily chart is hovering just below 50, and a slightly negative Moving Average Convergence Divergence (MACD) line hints at waning bullish momentum after recent gains.
On the topside, immediate resistance is seen at the 50-day EMA around $1.41, followed by the 100-day EMA near $1.52 and the channel top at $1.60; beyond that, the 200-day EMA at $1.75 and horizontal resistance at $1.90 form a broader supply zone.
On the downside, initial support aligns with the horizontal level at $1.30, while a deeper retreat would expose the lower boundary of the descending channel around $0.79, where buyers could attempt to rebuild a more durable floor.
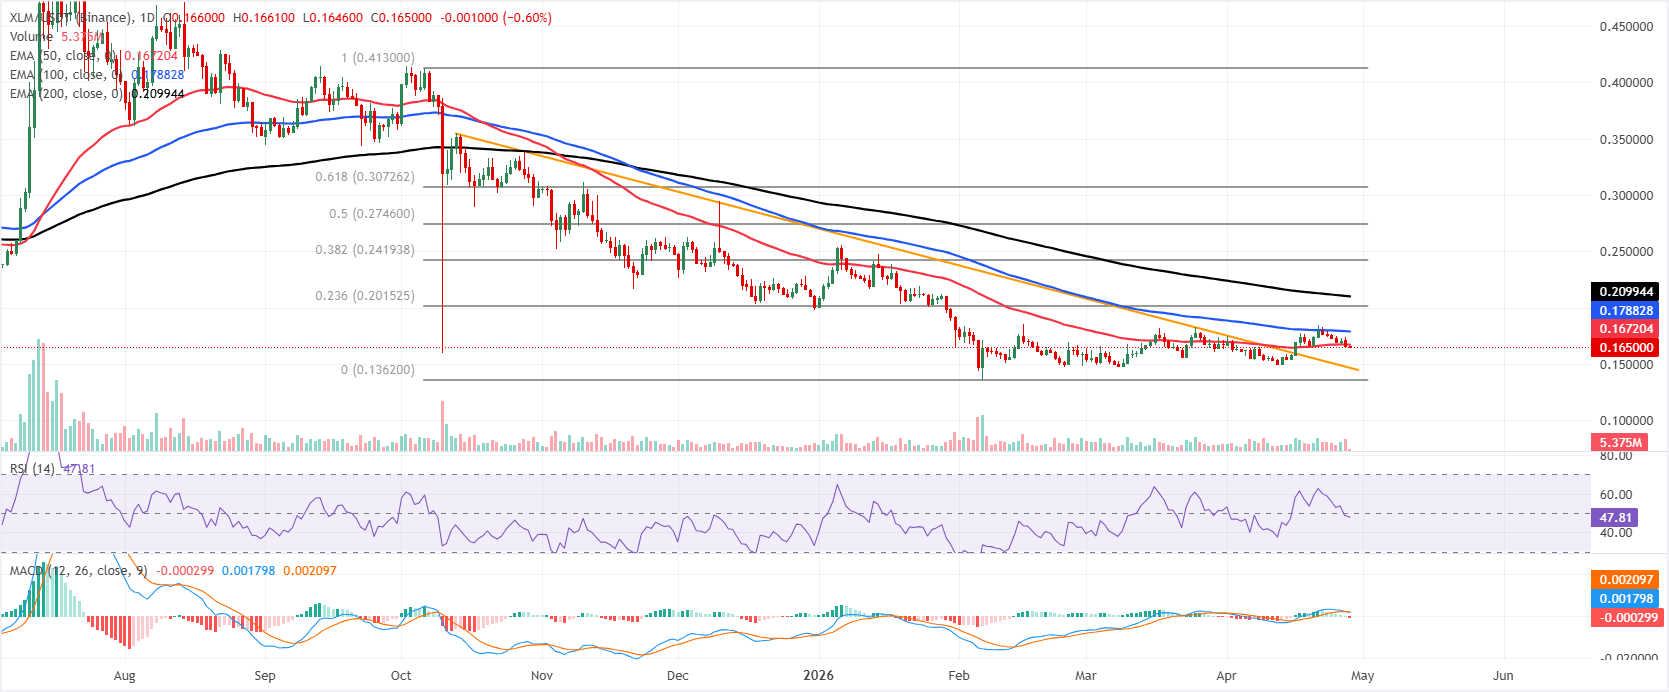
XLM technical outlook: Weakening momentum indicators
XLM price is trading at $0.165. Stellar remains under pressure as it holds below a stack of EMAs, with the 50-day EMA near $0.167, the 100-day EMA around $0.178 and the 200-day EMA close to $0.209, all acting as overhead supply.
The RSI on the daily chart around 48 remains slightly below neutral, and the MACD has slipped marginally into negative territory, which together hint at fading bullish momentum within a broader capped structure.
On the topside, initial resistance emerges at the 50-day EMA at $0.167, followed by the 100-day EMA at $0.178. Beyond that, the 23.6% Fibonacci retracement of the broader downswing sits near $0.201, ahead of the longer-term 200-day EMA at $0.209.
On the downside, the former descending trendline break area near $0.146 provides the first notable support, and a decisive break below this zone would expose a deeper retracement toward prior-cycle lows.
(The technical analysis of this story was written with the help of an AI tool.)

Lebih dari satu juta pengguna mengandalkan FXStreet untuk data pasar real-time, alat charting, wawasan ahli, dan berita forex. Kalender ekonomi komprehensif dan webinar edukatif membantu trader tetap mendapat informasi dan membuat keputusan terukur. FXStreet memiliki sekitar 60 profesional yang tersebar antara kantor pusat Barcelona dan berbagai wilayah global.
Baca Selengkapnya


