
Trade The World
BNB Price Forecast: BNB risks a 10% drop as sell-off wave amplifies
Oleh Vishal Dixit
Tanggal Diterbitkan: 26 Sep 2025 | Tanggal Dimodifikasi: 26 Sep 2025


POPULAR ARTICLES

BNB (BNB), previously known as Binance coin, trades below $1,000 after the 7% drop on the previous day. At the time of writing, BNB extends the loss by nearly 1% on Friday, approaching the support trendline of a rising channel.
- BNB reverts within a rising channel as the broader cryptocurrency market corrects.
- Derivatives data show significant capital outflows, as indicated by Open Interest, suggesting a lower level of traders’ confidence.
- The technical outlook suggests that BNB is approaching crucial crossroads as buying pressure wanes.
BNB (BNB), previously known as Binance coin, trades below $1,000 after the 7% drop on the previous day. At the time of writing, BNB extends the loss by nearly 1% on Friday, approaching the support trendline of a rising channel. Both the derivatives and technical outlook suggest a sudden decline in buying pressure, flashing risks of further correction.
Sell-side dominance arises in BNB derivatives
CoinGlass data indicates that the BNB Open Interest has decreased by 3.56% over the last 24 hours, now standing at $1.84 billion. This significant capital outflow from BNB derivatives indicates a risk-off sentiment among traders.
Adding to the lowered interest, the OI-weighted funding rate has dropped to 0.0062% from 0.0091% earlier in the day. Furthermore, the long liquidations of $11.91 million in the last 24 hours outpace short liquidations at $721,610, indicating a larger wipeout of bullish-aligned traders.
Finally, the 24-hour long-to-short ratio reads 0.9279, indicating that a greater number of short positions are active, suggesting a sell-side dominance.
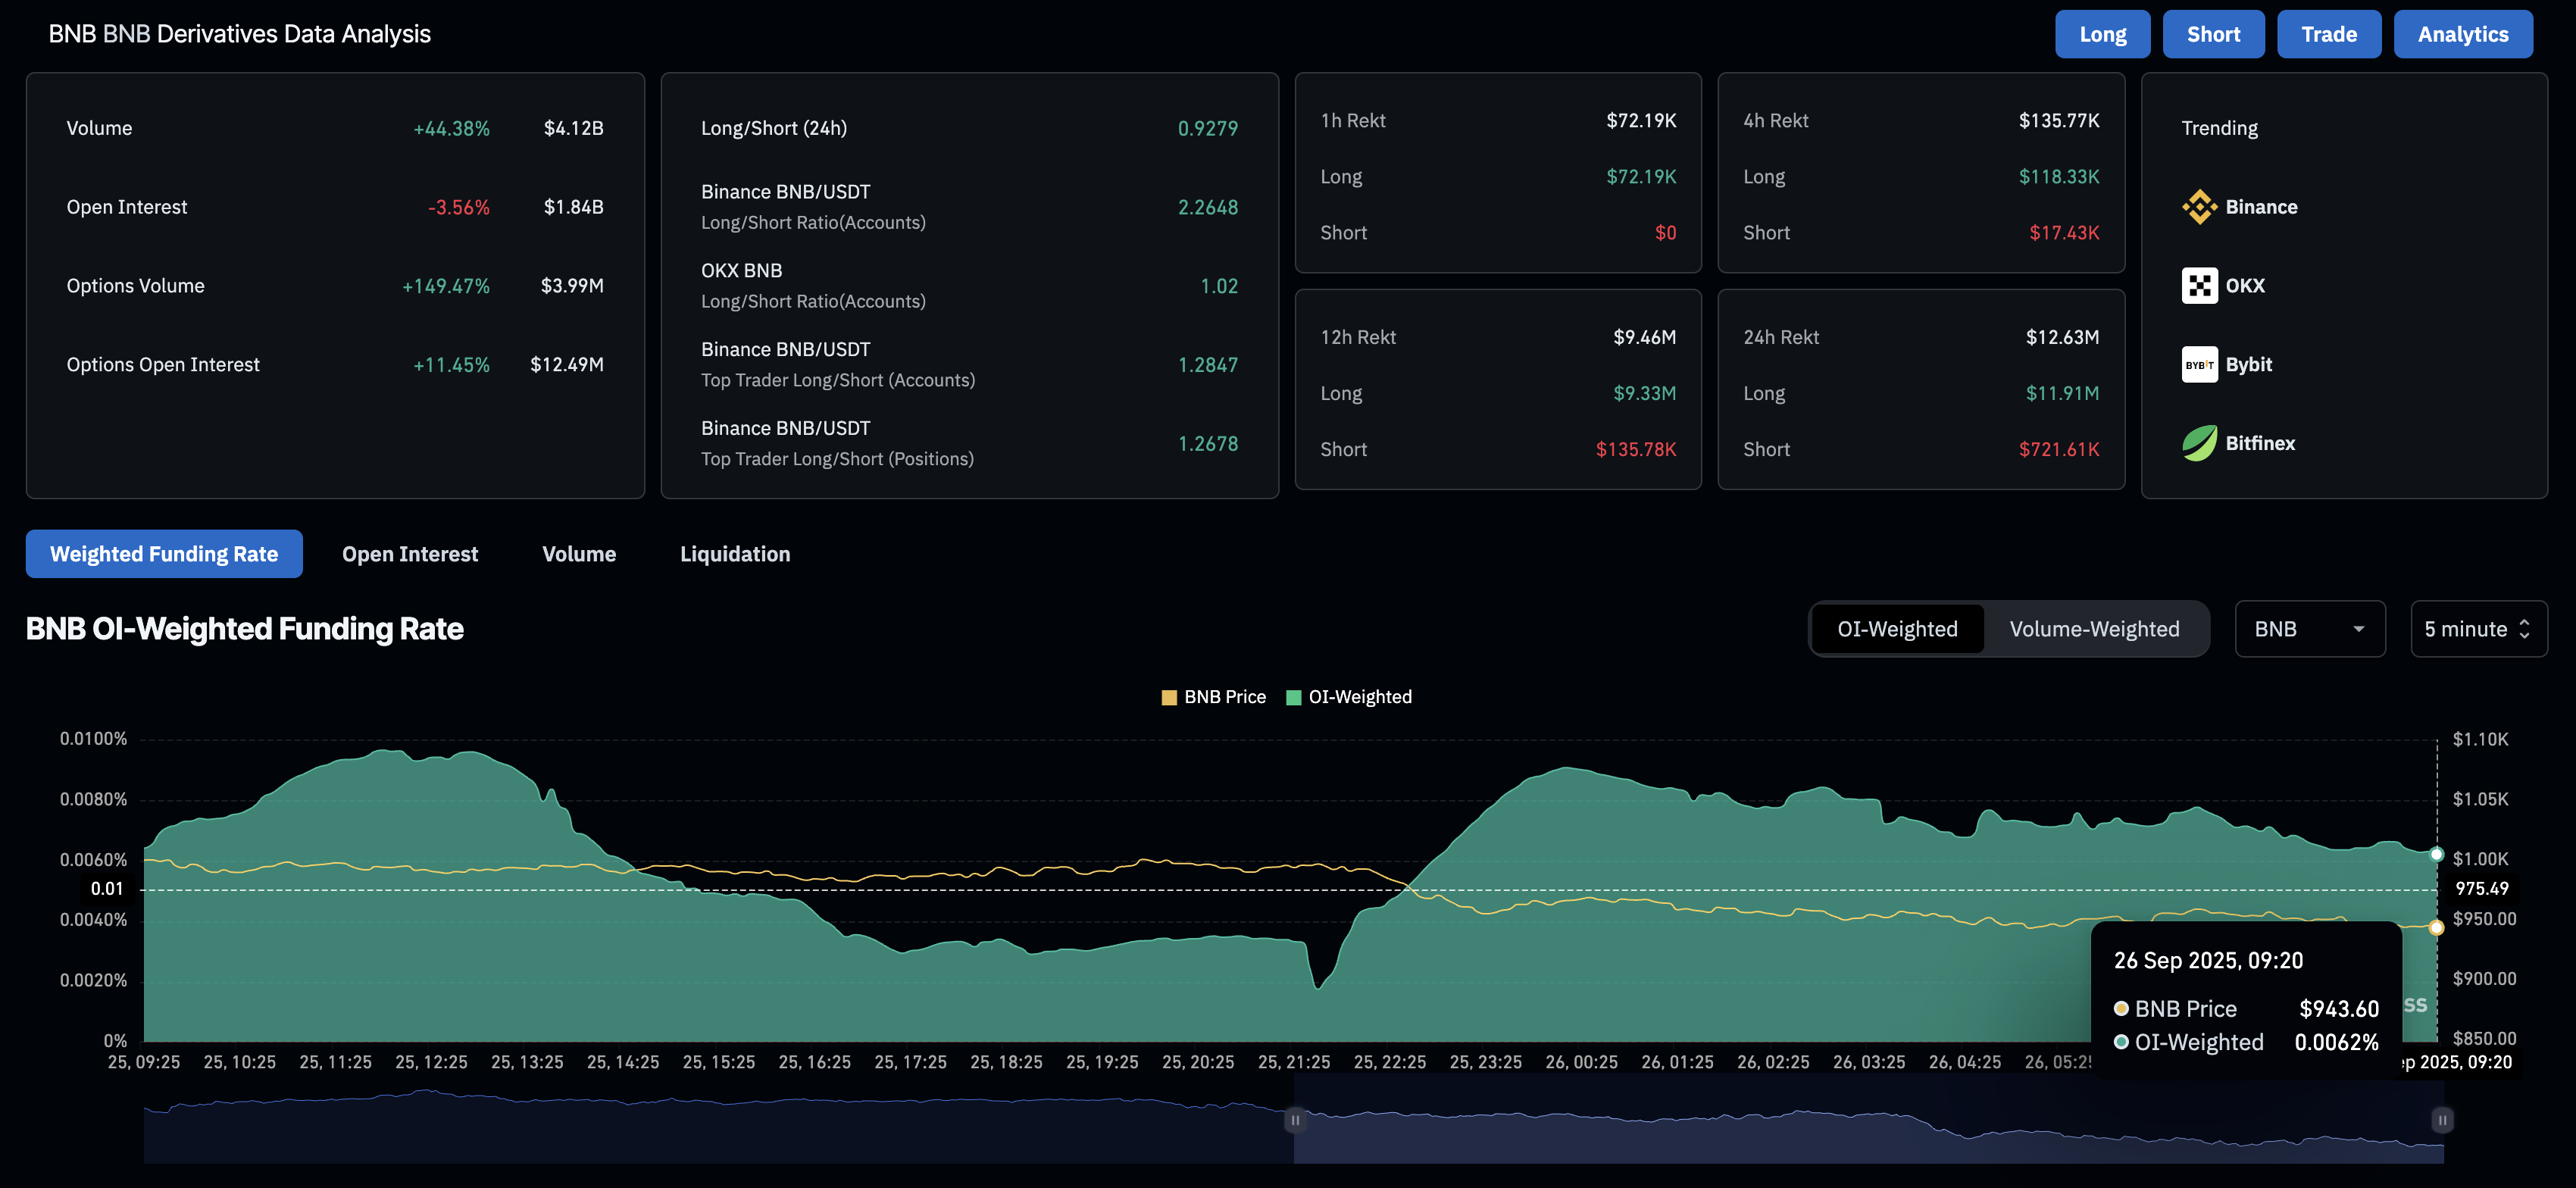
BNB derivatives. Source: CoinGlass
BNB risks channel breakdown as buying pressure wanes
BNB is approaching the lower boundary line of a rising channel pattern on the daily chart. The Centralized Exchange (CEX) token reversed from the overhead trendline at its all-time high of $1,083 on Sunday, igniting the current downcycle within the parallel channel.
To confirm the channel fallout, BNB bears must achieve a decisive close below the R1 pivot level, which serves as resistance-turned-support at $928. A potential downside breakout could extend the decline to the 50-day Exponential Moving Average (EMA) at $895, followed by the centre pivot level at $829.
The technical indicators on the daily chart reflect a decrease in buying pressure, which increases the chances of a potential breakdown. The Moving Average Convergence Divergence (MACD) extends the downside movement after crossing below its signal line on Thursday, indicating a rise in bearish momentum.
Additionally, the Relative Strength Index (RSI) reads 50 on the same chart, marking a significant decline from the overbought zone as buying pressure wanes.
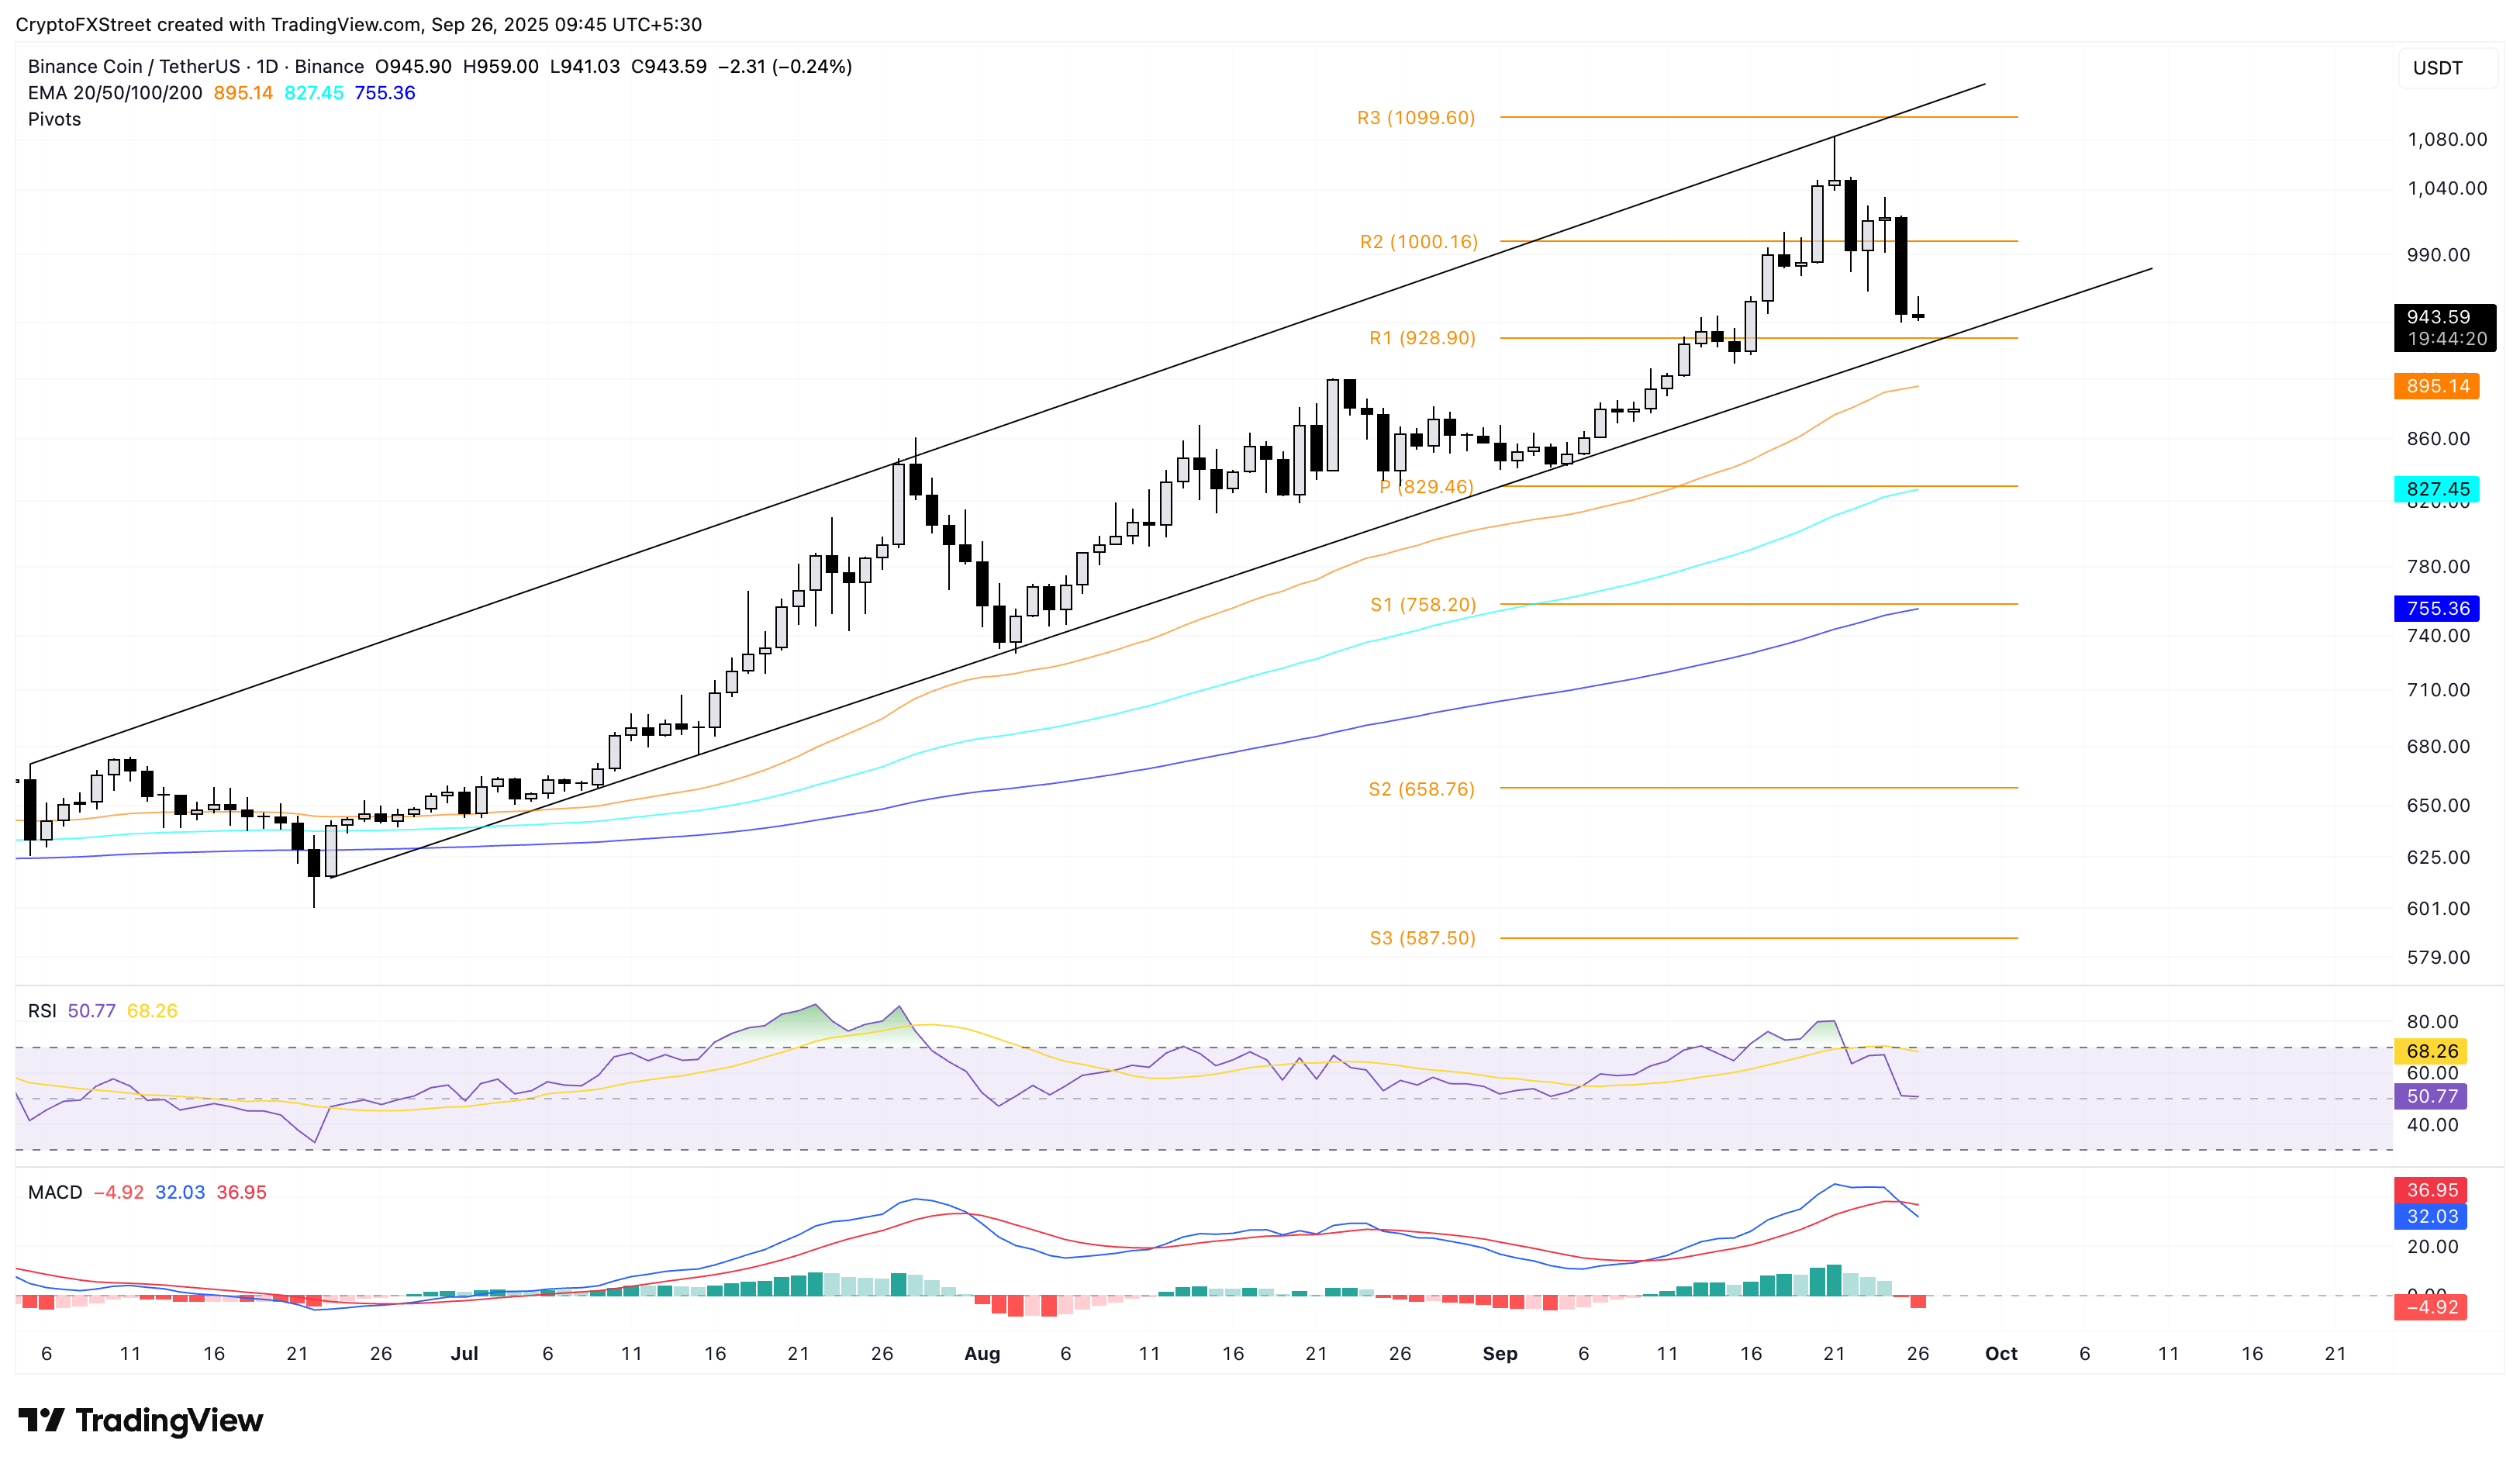
BNB/USDT daily price chart.
On the upside, if BNB rebounds from $928, it could retest the R2 resistance at $1,000 psychological milestone.

FXStreet
Lebih dari satu juta pengguna mengandalkan FXStreet untuk data pasar real-time, alat charting, wawasan ahli, dan berita forex. Kalender ekonomi komprehensif dan webinar edukatif membantu trader tetap mendapat informasi dan membuat keputusan terukur. FXStreet memiliki sekitar 60 profesional yang tersebar antara kantor pusat Barcelona dan berbagai wilayah global.
Read More


