
Cosmos Price Forecast: ATOM rebounds on rising on-chain, retail demand
Oleh Vishal Dixit
Tanggal Diterbitkan: 20 Jan 2026 | Tanggal Dimodifikasi: 20 Jan 2026


ARTIKEL POPULER

Cosmos (ATOM) trades near $2.50 at the time of writing on Tuesday, holding above the 20-day Exponential Moving Average (EMA). A steady rise in capital deposited on the network and ATOM futures Open Interest suggests that on-chain demand is consistently increasing with retail activity.
- ATOM extends recovery on Tuesday after a bullish pinbar candlestick formed near the 20-day EMA the previous day.
- Data shows the total chain value on Cosmos is $1.24 billion, which is consistent with 99.5% of ATOM.
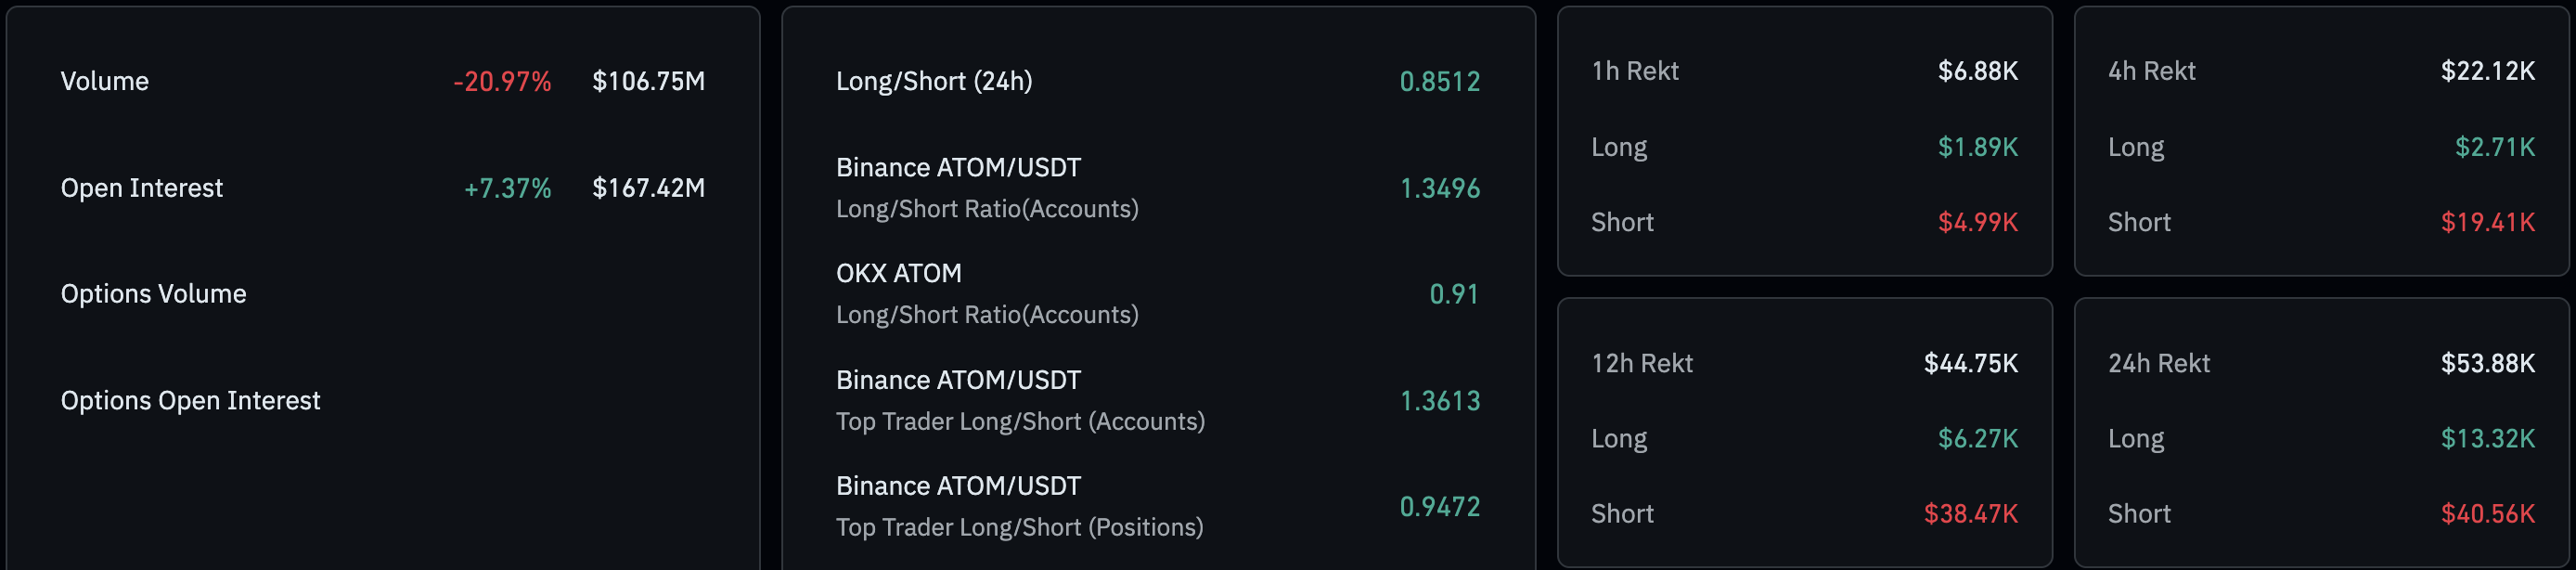
- Derivatives data suggests renewed interest among retail traders as ATOM futures Open Interest rises.
Cosmos (ATOM) trades near $2.50 at the time of writing on Tuesday, holding above the 20-day Exponential Moving Average (EMA). A steady rise in capital deposited on the network and ATOM futures Open Interest suggests that on-chain demand is consistently increasing with retail activity. The technical outlook for ATOM remains mixed, as indicators suggest a downside bias.
Cosmos regains on-chain, retail demand
According to Mintscan data, the Total Chain Value of Cosmos stands at $1.24 billion on Monday, up from $938.50 million on December 31. Over 99% of the value is derived from ATOM, while Inter-Blockchain Communication (IBC) accounts for $13.71 million of outflow from the blockchain.
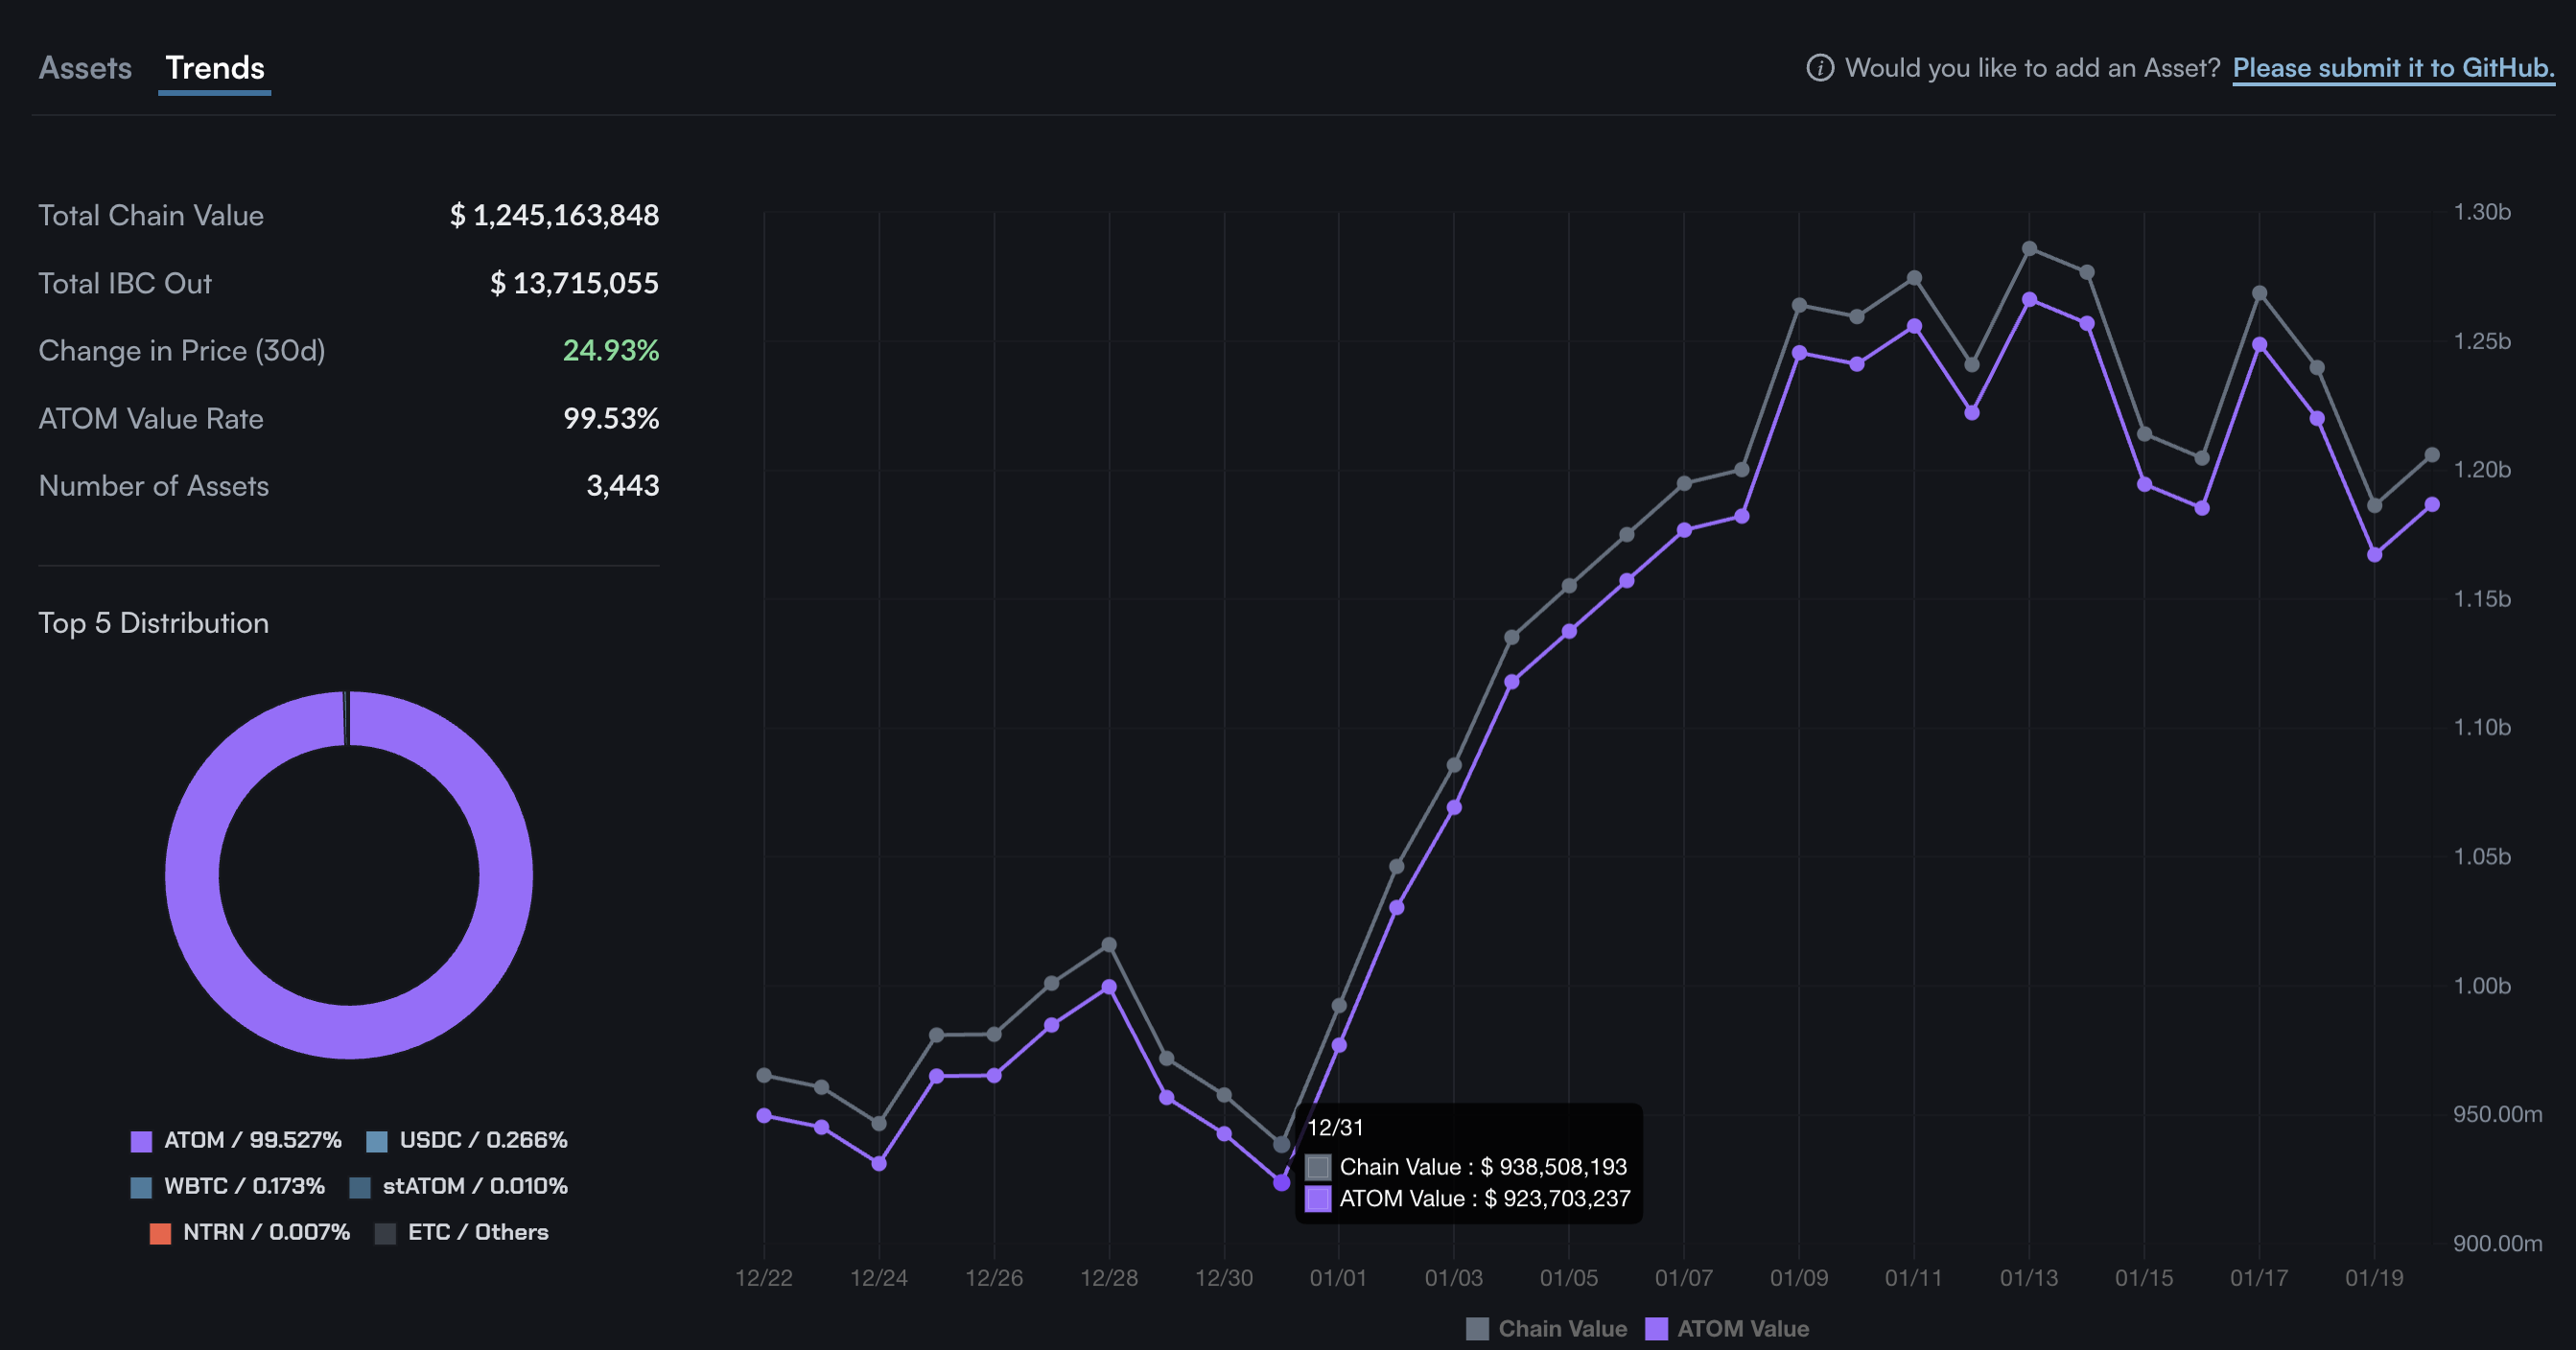
On the derivatives side, CoinGlass data shows ATOM futures Open Interest (OI) is up 7.37% over the last 24 hours, to $167.42 million, indicating a capital influx consistent with renewed on-chain demand. A steady rise in chain value and OI could shift the bias upside for ATOM.
Technical outlook: Will Cosmos extend recovery?
Cosmos holds above the 20-day EMA at $2.43 and the 50-day EMA at $2.40, with both averages edging higher and supporting the short-term bid. Still, ATOM remains well beneath a falling 200-day EMA at $3.24, reflecting a broader downtrend.
The Moving Average Convergence Divergence (MACD) indicator crossed below the red signal line on the daily chart, and the histogram is extending to the downside, suggesting a rise in bearish momentum. If the histogram returns to positive, it would improve bullish conviction, while sustained weakness could reinforce the downside bias.
The Relative Strength Index (RSI) is at 57 on the same timeframe, confirming a slightly bullish momentum.
The October 11 low at $2.85 could serve as an immediate target for a potential rebound in ATOM as a support-turned-resistance.
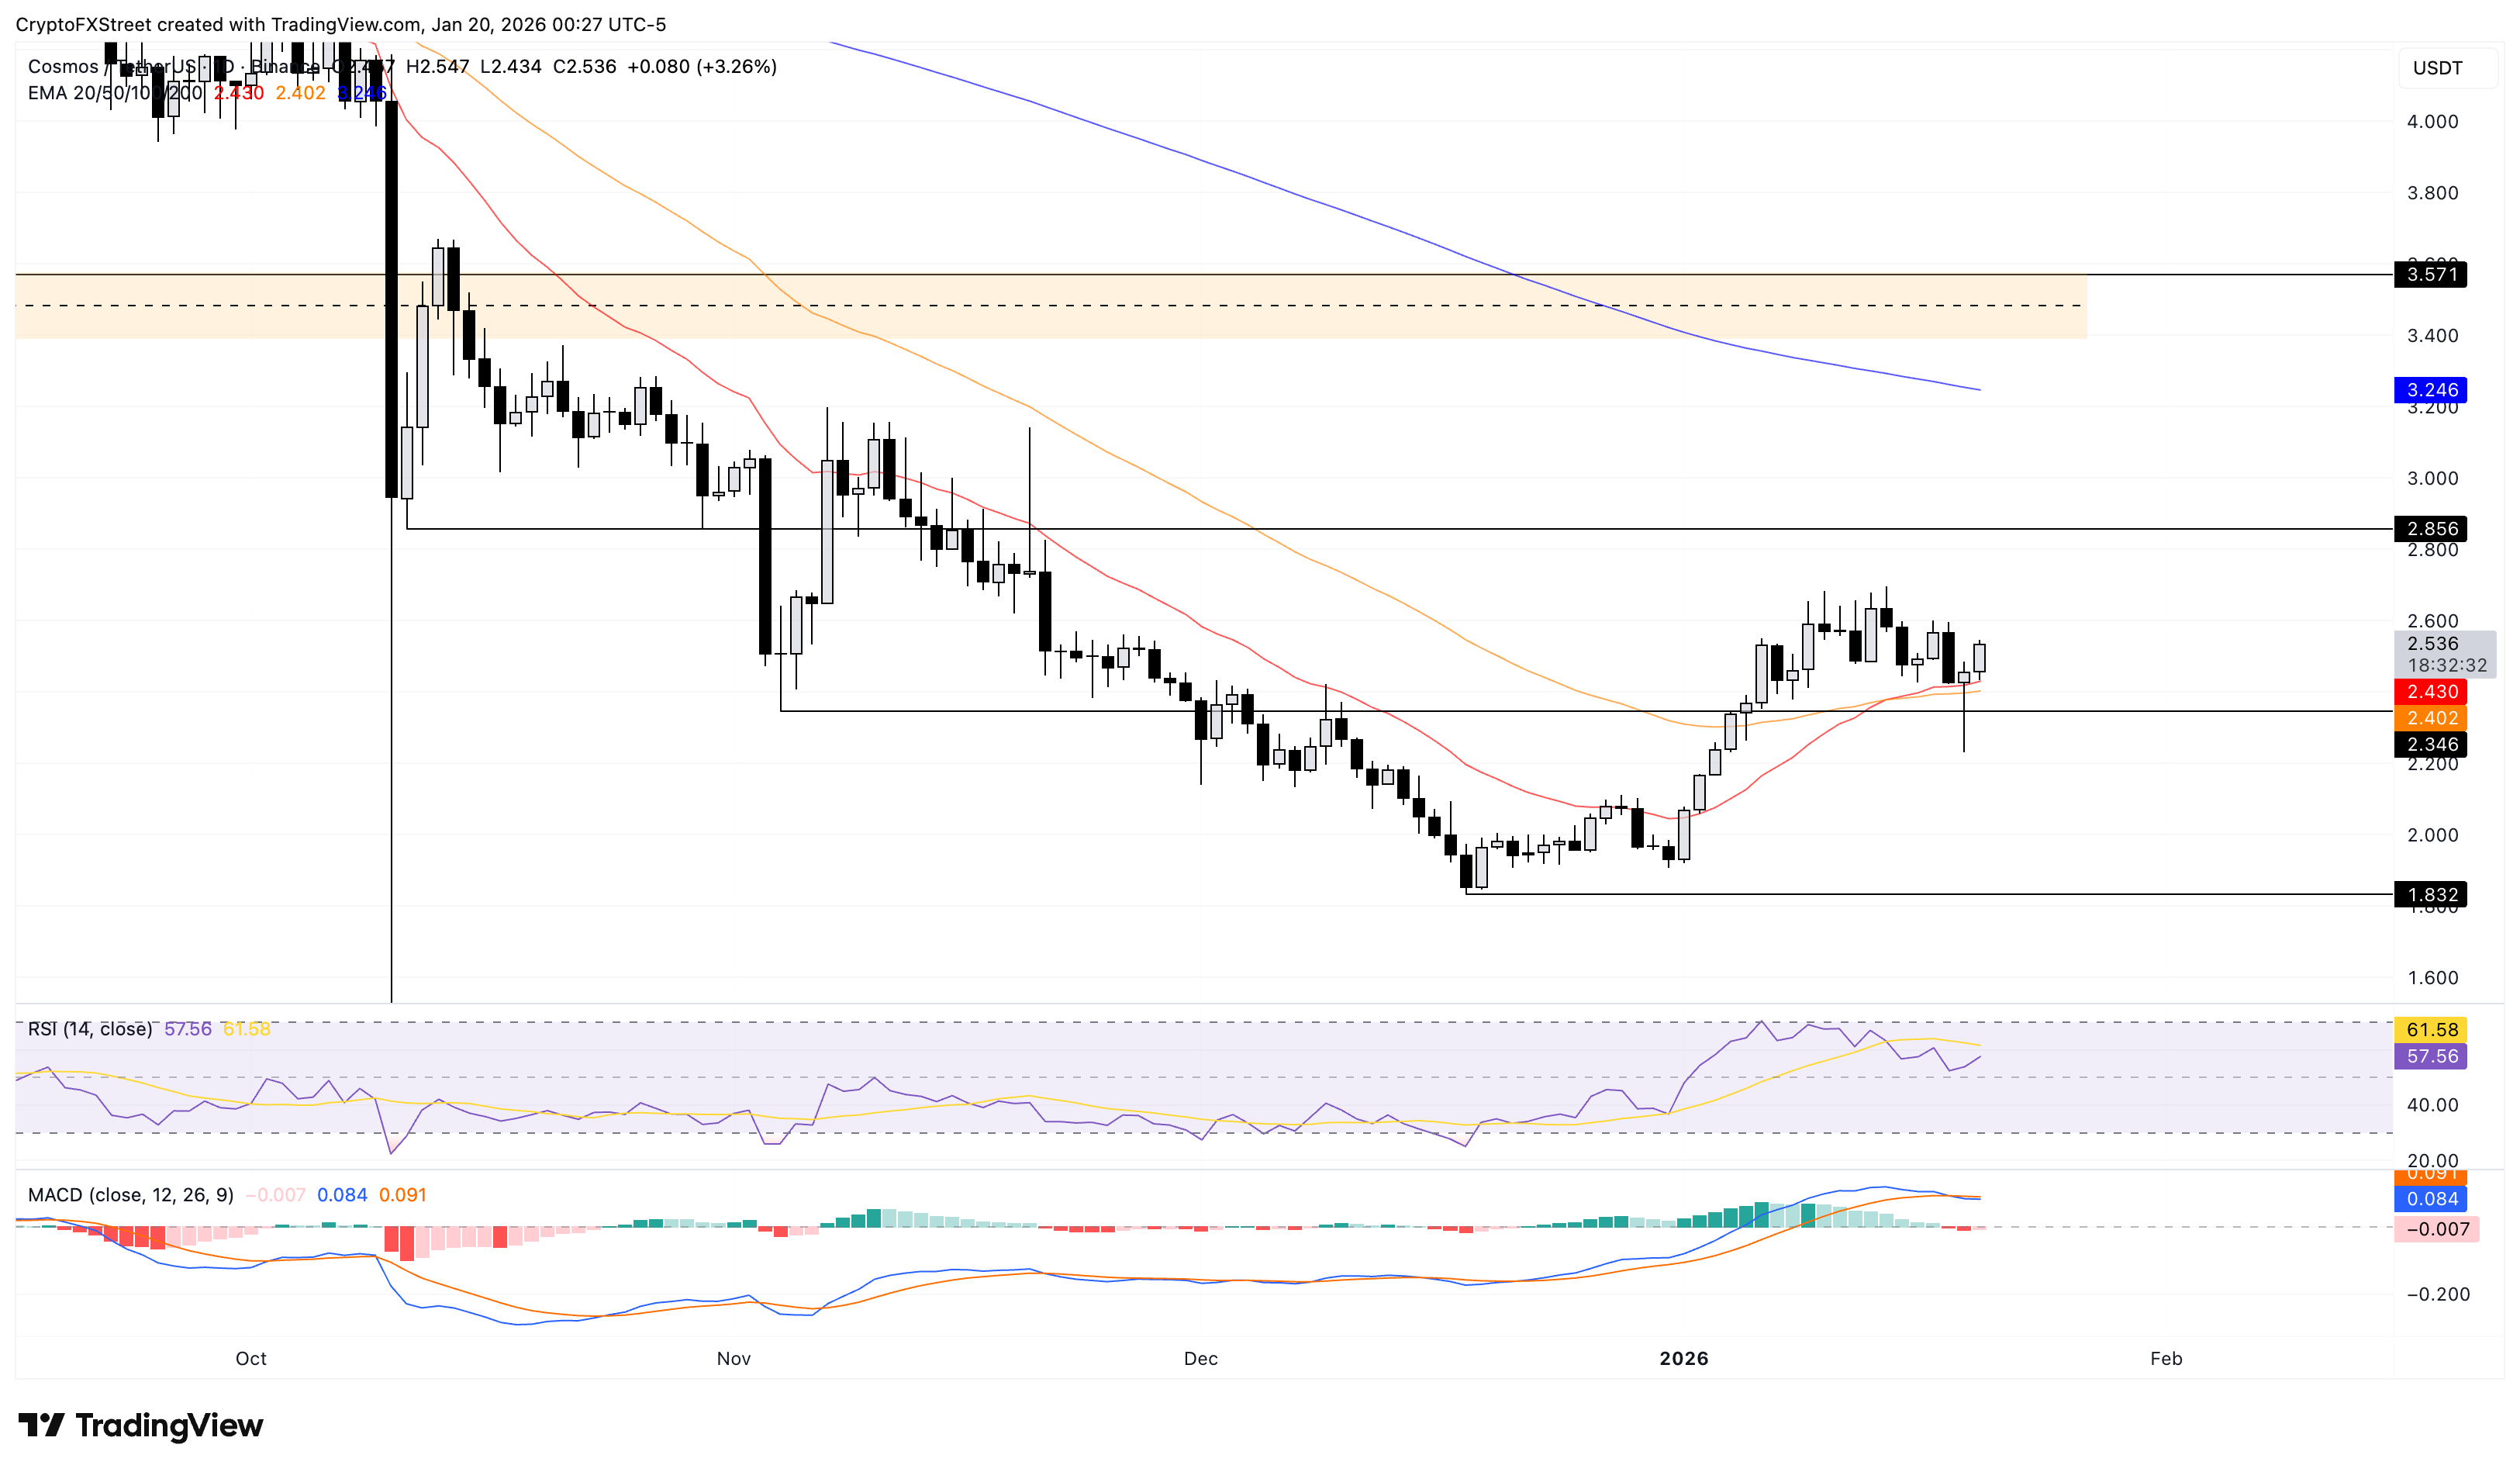
On the contrary, if ATOM marks a daily close below the November 4 low at $2.34, it would likely open the door to the $2.00 psychological support level.
(The technical analysis of this story was written with the help of an AI tool.)

Lebih dari satu juta pengguna mengandalkan FXStreet untuk data pasar real-time, alat charting, wawasan ahli, dan berita forex. Kalender ekonomi komprehensif dan webinar edukatif membantu trader tetap mendapat informasi dan membuat keputusan terukur. FXStreet memiliki sekitar 60 profesional yang tersebar antara kantor pusat Barcelona dan berbagai wilayah global.
Baca Selengkapnya


