
EUR/USD hesitates near monthly lows ahead of US Retail Sales, PPI data
Oleh Guillermo Alcala
Tanggal Diterbitkan: 14 Jan 2026 | Tanggal Dimodifikasi: 14 Jan 2026


ARTIKEL POPULER

EUR/USD remains hovering within a tight range around the 1.1650 level, showing a flat performance on the daily chart.
- EUR/USD edges up above 1.1650, but remains close to one-month lows, near 1.1620.
- The US Dollar gives away gains ahead of US PPI, Retail Sales data
- The pair remains in a bearish channel with one-month lows at 1.1618 in sight.
EUR/USD remains hovering within a tight range around the 1.1650 level, showing a flat performance on the daily chart. The softer-than-expected US core Consumer Price Index (CPI) data released on Tuesday failed to dent the US Dollar's (USD) recovery, and investors await US retail consumption and factory inflation figures for further insight into the US economic momentum
Figures from the US Bureau of Labour Statistics (BLS) revealed that price pressures remained fairly steady in December, against market hopes of an uptick in the core inflation. The data, however, did not change the Federal Reserve's (Fed) monetary policy expectations. Futures market is practically fully pricing a steady interest rate decision in the late-January meeting, and the chances of a rate cut in March have dropped to 26% from nearly 40% one week ago, according to the CME FedWatch tool.
Market volatility remains subdued in Europe in the absence of key macroeconomic releases. In the US, Retail Sales data and an array of Fed speakers will be in focus, although traders will keep an eye on the US Supreme Court, which might rule on US President Donald Trump’s tariffs later on Wednesday.
Euro Price Today
The table below shows the percentage change of Euro (EUR) against listed major currencies today. Euro was the strongest against the Australian Dollar.
| USD | EUR | GBP | JPY | CAD | AUD | NZD | CHF | |
|---|---|---|---|---|---|---|---|---|
| USD | -0.02% | -0.11% | -0.32% | -0.03% | 0.06% | 0.02% | 0.03% | |
| EUR | 0.02% | -0.09% | -0.31% | 0.01% | 0.08% | 0.05% | 0.06% | |
| GBP | 0.11% | 0.09% | -0.19% | 0.08% | 0.17% | 0.14% | 0.15% | |
| JPY | 0.32% | 0.31% | 0.19% | 0.30% | 0.39% | 0.34% | 0.36% | |
| CAD | 0.03% | -0.01% | -0.08% | -0.30% | 0.09% | 0.05% | 0.06% | |
| AUD | -0.06% | -0.08% | -0.17% | -0.39% | -0.09% | -0.03% | -0.02% | |
| NZD | -0.02% | -0.05% | -0.14% | -0.34% | -0.05% | 0.03% | 0.01% | |
| CHF | -0.03% | -0.06% | -0.15% | -0.36% | -0.06% | 0.02% | -0.01% |
The heat map shows percentage changes of major currencies against each other. The base currency is picked from the left column, while the quote currency is picked from the top row. For example, if you pick the Euro from the left column and move along the horizontal line to the US Dollar, the percentage change displayed in the box will represent EUR (base)/USD (quote).
Daily Digest Market Movers: US CPI data failed to hurt the US Dollar
- The US Dollar maintains its moderate constructive tone intact, despite the softer-than-expected core CPI figure seen on Tuesday. Headline US inflation grew 0.3% pace in December and 2.7% year-on-year, in line with market expectations, while the core CPI slowed to 0.2% from 0.3% the previous month and grew at a steady 2.6% annual pace, against market expectations of 0.3% and 2.7% increases, respectively.
- The US ADP employment 4-week average report, on the other hand, revealed an 11.75K increase in the first week of 2026, following the previous 11K. This reading marks the fifth consecutive week with a net increase in jobs, which has contributed to easing concerns about the labour market and strengthens the case for steady Fed interest rates in the coming months.
- Also on Tuesday, the heads of the European Central Bank (ECB), the Bank of England (BoE), the Bank of Canada (BoC), and nine other central banks released a statement showing their solidarity with Federal Reserve Chairman Powell in reaction to the unprecedented attacks from US President Donald Trump. The central bankers defended the independence of their institutions as a cornerstone for price, financial, and economic stability in the interest of the citizens that they serve.
- Later on Wednesday, November's US Retail Sales are expected to show that consumption bounced up 0.4% after a flat performance in October, boosted by higher car sales. Excluding autos, sales of all other items are seen growing at a 0.4% pace, unchanged from last month.
- A slew of Fed speakers will also take the stage during the American session. The focus will be on Governor Stephen Miran, Trump's latest pick for the Board, and a vocal dove. Philadelphia Fed President Anna Paulson, Atlanta Fed President Raphael Bostic, Minneapolis Fed President Neel Kashkari, and New York Fed President John Williams will also meet the press on Wednesday.
Technical Analysis: EUR/USD bears eye the 1.1615 support area
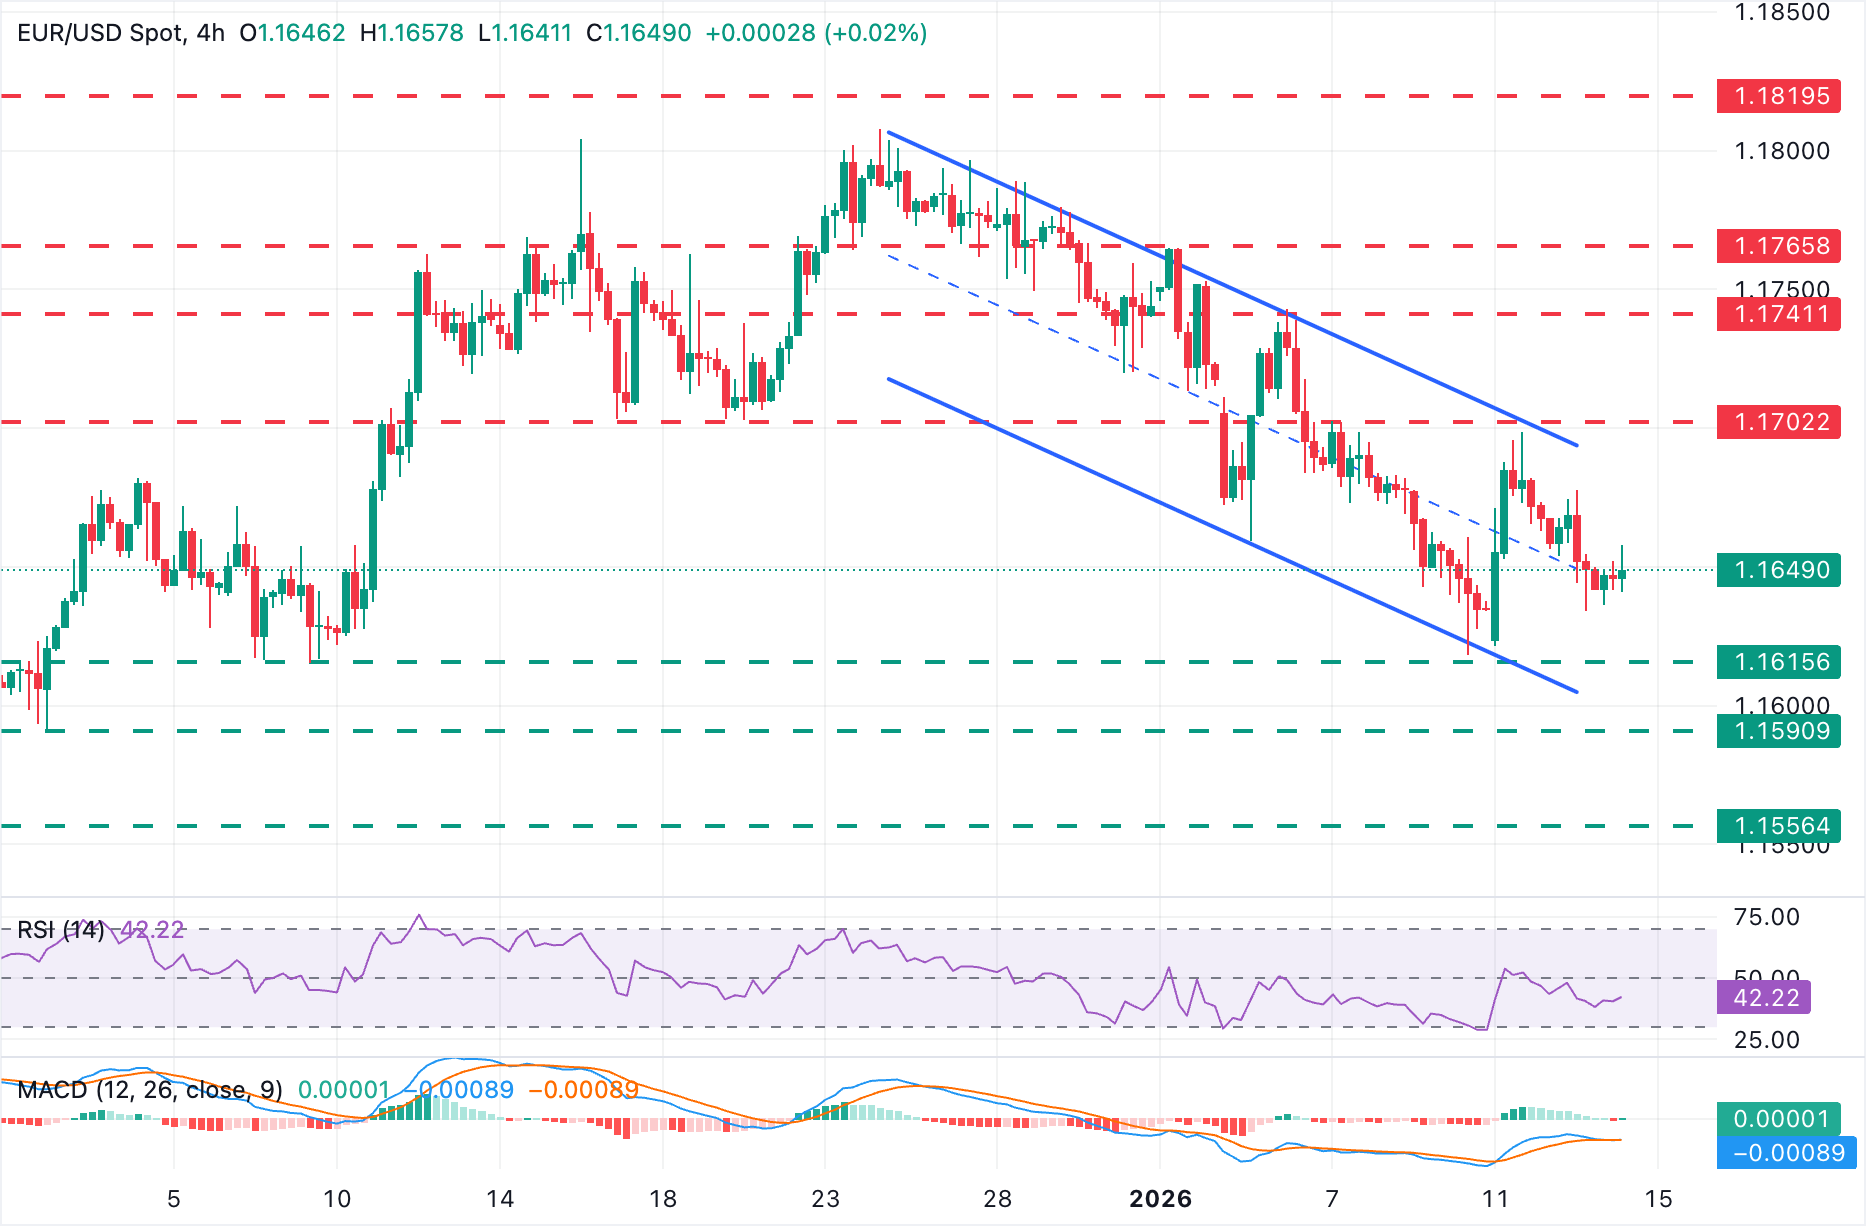
The EUR/USD pair treads water below the 1.1650 line, after pulling back from the 1.1700 area earlier this week. Technical indicators show a neutral-to-bearish tone. The Moving Average Convergence Divergence (MACD) is practically flat on the 4-hour chart, showing a lack of momentum, while the Relative Strength Index (RSI) has dropped below 43, pointing to fading demand.
Price action remains trapped within a descending channel from late December highs. The intraday low is near 1.1635, and the one-month low of 1.1618 remains in the bears' sight. Further down, the confluence of the channel bottom and December 2 lows, right below 1.1600, is a key area.
Immediate resistance stands at the channel top, now around 1.1685, ahead of Monday's high, near 1.1700. Further up, the target is the January 6 high, in the area of 1.1740.
(The technical analysis of this story was written with the help of an AI tool.)
Economic Indicator
Producer Price Index (YoY)
The Producer Price Index released by the Bureau of Labor statistics, Department of Labor measures the average changes in prices in primary markets of the US by producers of commodities in all states of processing. Changes in the PPI are widely followed as an indicator of commodity inflation. Generally speaking, a high reading is seen as positive (or bullish) for the USD, whereas a low reading is seen as negative (or bearish).
Read more.Next release: Wed Jan 14, 2026 13:30
Frequency: Monthly
Consensus: -
Previous: 2.7%
Source: US Bureau of Labor Statistics
Economic Indicator
Retail Sales (YoY)
The Retail Sales data, released by the US Census Bureau on a monthly basis, measures the value in total receipts of retail and food stores in the United States. Retail Sales measure the change in the total value of goods sold at the retail level during a year. Retail Sales data is widely followed as an indicator of consumer spending, which is a major driver of the US economy. A result higher than expected is typically viewed as positive or bullish for the USD, whereas a lower than expected result is considered negative or bearish for the USD.
Read more.Next release: Wed Jan 14, 2026 13:30
Frequency: Monthly
Consensus: -
Previous: 3.5%
Source: US Census Bureau
Retail Sales data published by the US Census Bureau is a leading indicator that gives important information about consumer spending, which has a significant impact on the GDP. Although strong sales figures are likely to boost the USD, external factors, such as weather conditions, could distort the data and paint a misleading picture. In addition to the headline data, changes in the Retail Sales Control Group could trigger a market reaction as it is used to prepare the estimates of Personal Consumption Expenditures for most goods.

Lebih dari satu juta pengguna mengandalkan FXStreet untuk data pasar real-time, alat charting, wawasan ahli, dan berita forex. Kalender ekonomi komprehensif dan webinar edukatif membantu trader tetap mendapat informasi dan membuat keputusan terukur. FXStreet memiliki sekitar 60 profesional yang tersebar antara kantor pusat Barcelona dan berbagai wilayah global.
Baca Selengkapnya


