
Trade The World
Litecoin Price Forecast: LTC drops $78 as downside risks intensify
Oleh Manish Chhetri
Tanggal Diterbitkan: 16 Dec 2025 | Tanggal Dimodifikasi: 16 Dec 2025


POPULAR ARTICLES

Litecoin (LTC) remains under heavy selling pressure, trading below $78 on Tuesday, extending its losing streak to seven consecutive days after being rejected at a key resistance zone. With social interest fading and momentum indicators turning increasingly bearish, downside risks remain dominant.
- Litecoin price extends its decline for a seventh consecutive day on Tuesday after failing to break through a key resistance zone.
- LTC’s social dominance has been consistently falling since early December, signaling fading market interest and weakening sentiment.
- Traders should be cautious, as momentum indicators signal bearishness alongside negative funding rates.
Litecoin (LTC) remains under heavy selling pressure, trading below $78 on Tuesday, extending its losing streak to seven consecutive days after being rejected at a key resistance zone. With social interest fading and momentum indicators turning increasingly bearish, downside risks remain dominant.
Fading social interest weighs on Litecoin price
Santiment’s Social Dominance metric for Litecoin supports a bearish outlook. The index measures the share of LTC-related discussions across the cryptocurrency media. It has consistently fallen since early December, reaching an annual low of 0.032% on Tuesday. This fall indicates fading market interest and weakening sentiment among LTC investors.
 [09-1765857309879-1765857309881.01.02, 16 Dec, 2025].png)
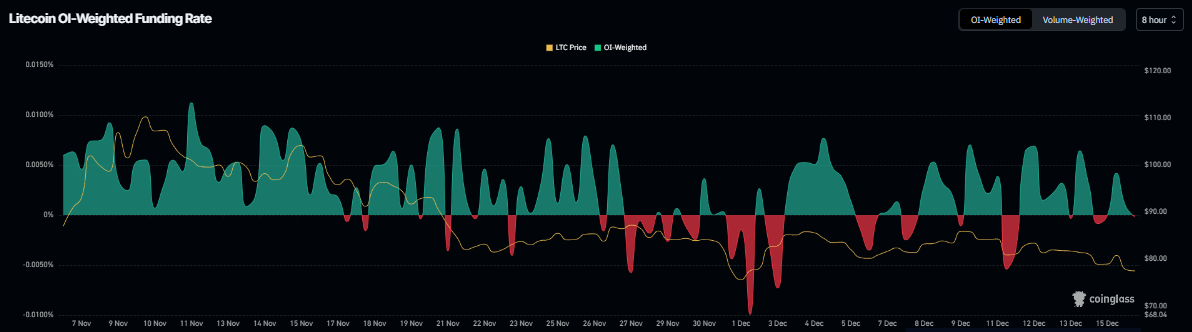
On the derivatives front, data further supports a negative outlook for Litecoin. Coinglass’s OI-Weighted Funding Rate data show that the number of traders betting that the price of LTC will slide further exceeds those anticipating a price increase.
The metric flipped to a negative rate on Tuesday, now at -0.002%, suggesting that shorts are paying longs. Historically, when the funding rates have flipped negative, LTC prices have fallen sharply.
Litecoin Price Forecast: LTC bears are in control of the momentum
Litecoin price was rejected around the 38.20% Fibonacci retracement level at $84.63 on December 10 and corrected nearly 9% with six red daily candlesticks until Monday, retesting the weekly support at $77.19. As of writing on Tuesday, LTC hovers around $77.51.
If LTC continues its correction and closes below the weekly support at $77.19 on a daily basis, it could extend the decline to the next support at $66.51.
The Relative Strength Index (RSI) on the daily reads 37, below its neutral level of 50 and pointing downward, indicating bearish momentum is increasing. Additionally, the Moving Average Convergence Divergence (MACD) indicator showed a bearish crossover on Monday, further supporting the negative outlook.

On the other hand, if the weekly support at $77.19 holds, LTC could extend the recovery toward the 38.20% Fibonacci retracement level at $84.63.

FXStreet
Lebih dari satu juta pengguna mengandalkan FXStreet untuk data pasar real-time, alat charting, wawasan ahli, dan berita forex. Kalender ekonomi komprehensif dan webinar edukatif membantu trader tetap mendapat informasi dan membuat keputusan terukur. FXStreet memiliki sekitar 60 profesional yang tersebar antara kantor pusat Barcelona dan berbagai wilayah global.
Read More


