
Trade The World
Pepe Price Forecast: PEPE risks 100-day EMA fallout as bullish interest fades
Oleh Vishal Dixit
Tanggal Diterbitkan: 9 Jan 2026 | Tanggal Dimodifikasi: 9 Jan 2026


POPULAR ARTICLES

Pepe (PEPE) is under extreme selling pressure, trading in the red for the fifth consecutive day, down 1% at press time on Friday. Pepe’s decline following a 72% hike last week suggests a likely profit-booking phase, while on-chain data indicates declining network activity.
- Pepe reverses to its 100-day EMA after a 15% decline so far this week, with five consecutive days of losses.
- On-chain data shows a steep decline in network growth amid declining social interest.
- The technical outlook for Pepe shifts bearish as buying pressure wanes, risking fallout of the 100-day EMA.
Pepe (PEPE) is under extreme selling pressure, trading in the red for the fifth consecutive day, down 1% at press time on Friday. Pepe’s decline following a 72% hike last week suggests a likely profit-booking phase, while on-chain data indicates declining network activity. The technical outlook for PEPE focuses on the 100-day Exponential Moving Average (EMA) as the crucial support level.
On-chain and retail interest declines
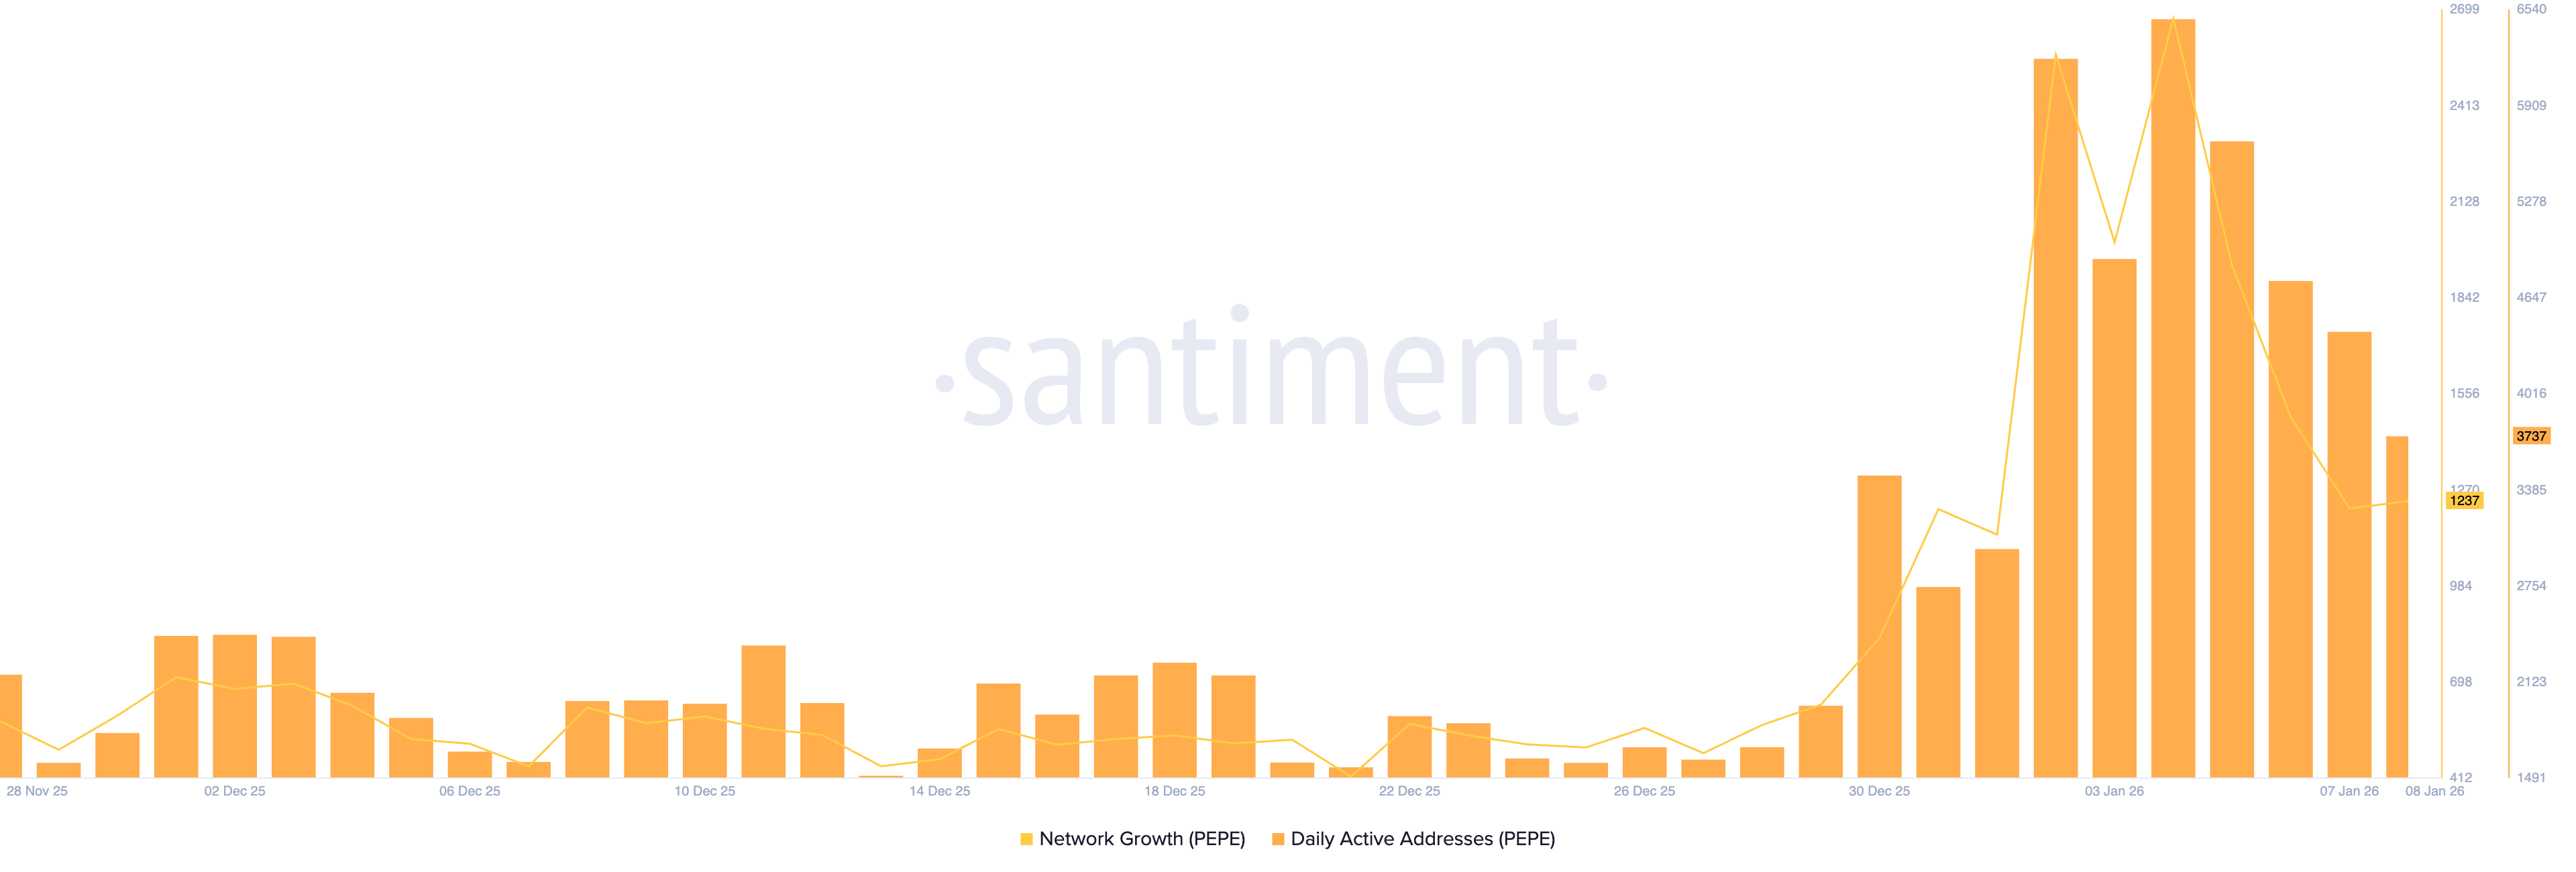
Pepe is losing user interest so far this week, indicating a cool-off period after last week’s sudden network growth. Santiment data shows that network growth – the number of new participating addresses – dropped to 1,237 on Thursday, from the 2,673 peak on Sunday.
Corroborating the decline in on-chain users, the daily active address count dropped to 3,737 on Thursday, from 6,476 in the same period.
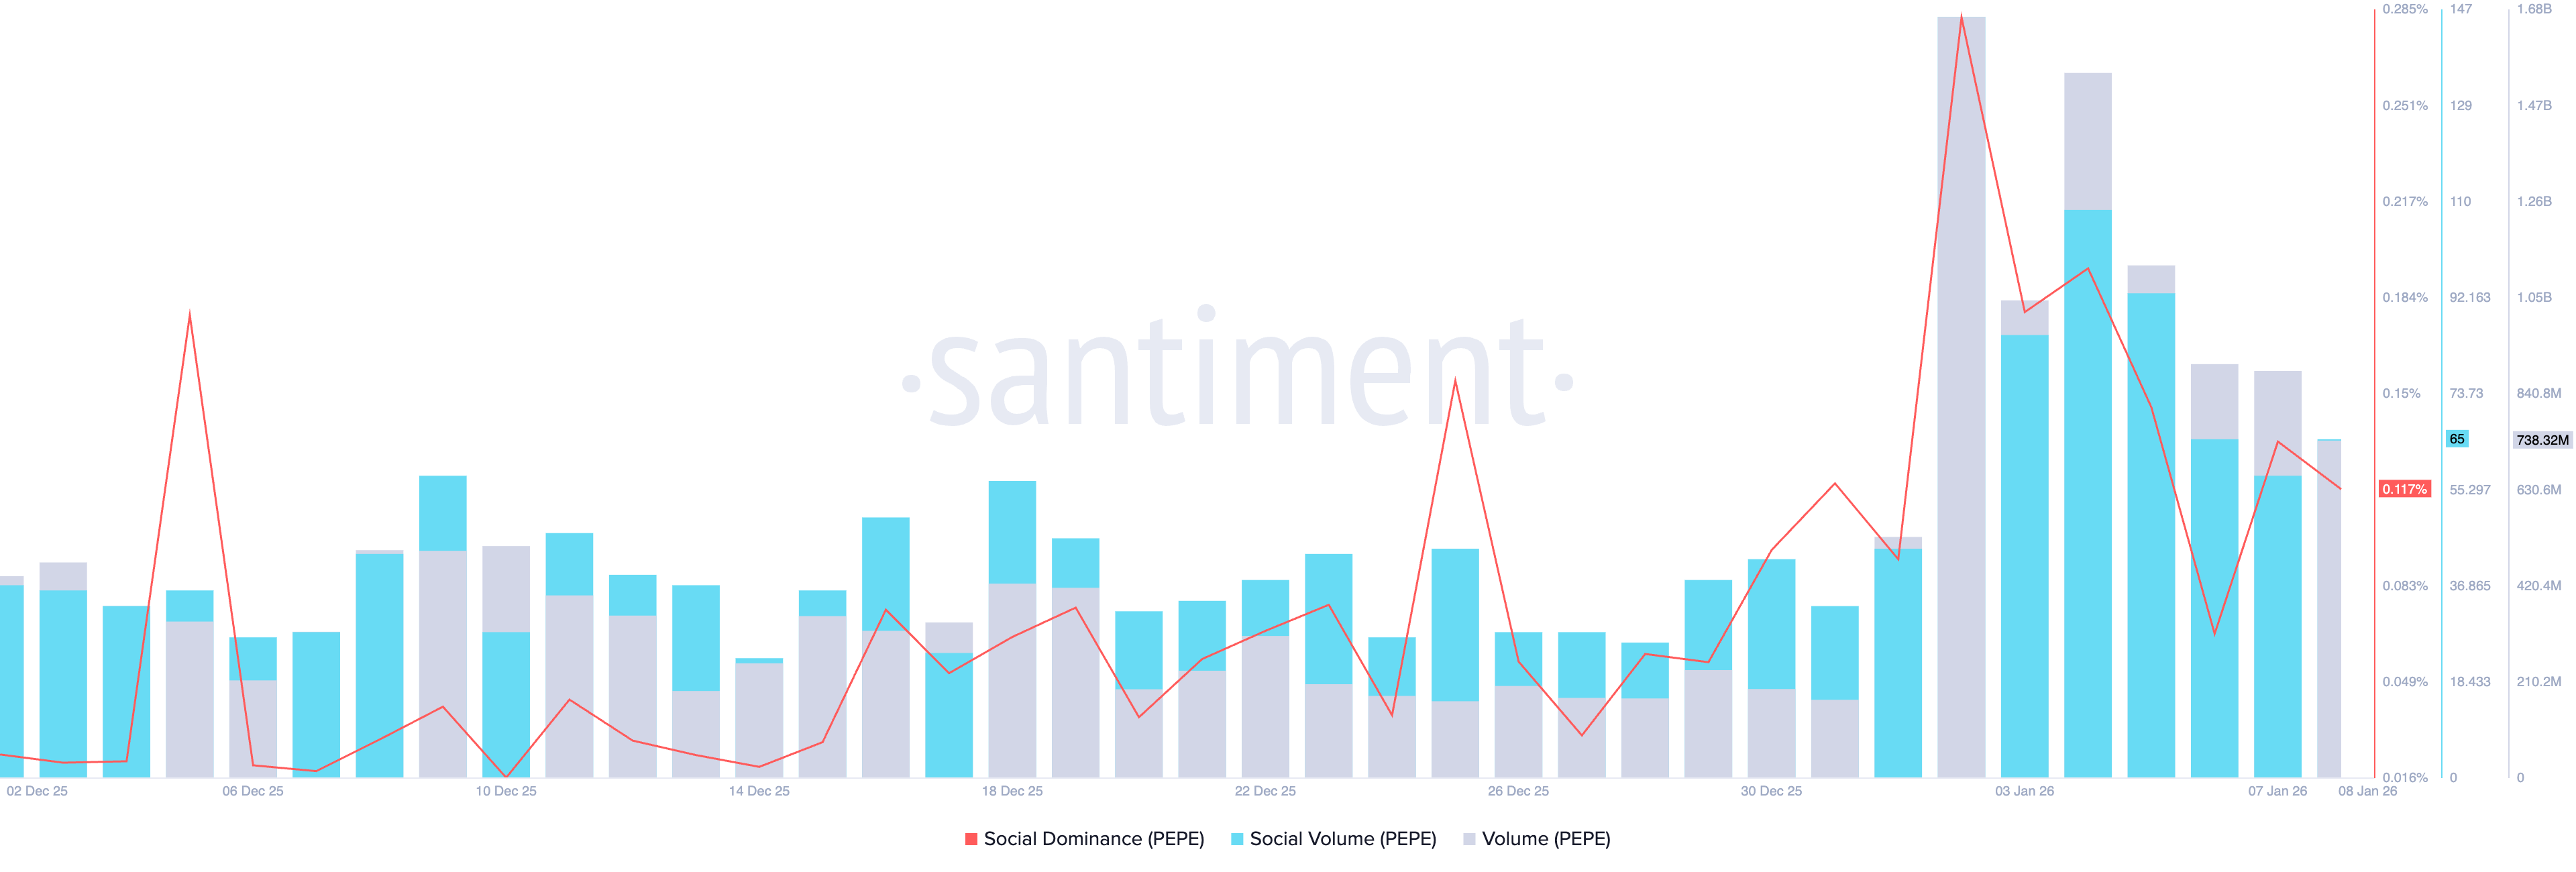
A declining trend in Pepe’s trading volume to 738.32 million PEPE on Thursday, from the 1.66 billion peak in January, indicates decreased liquidity and market participation. Additionally, Pepe is losing retail interest, as its social dominance – its share of media discussion – stood at 0.117% on Thursday, down from 0.282% on January 2.
Technical outlook: Will Pepe hold at the 100-day EMA?
Pepe tests the 100-day EMA at $0.00000598 after a 15% reversal from the $0.00000726 peak on Monday. If the frog-themed memecoin secures a decisive daily close below this moving average, it could extend the decline to the 50-day EMA at $0.00000519, roughly aligning with the November 4 low at $0.00000521.
Momentum indicators on the daily chart indicate a steep decline in buying pressure during PEPE’s pullback. The Relative Strength Index (RSI) at 60 exits the overbought zone, inching toward the halfway line. At the same time, the Moving Average Convergence Divergence (MACD) approaches the signal line as green histogram bars decline. A potential crossover and fresh red histogram bars below the zero line would flash a sell signal.
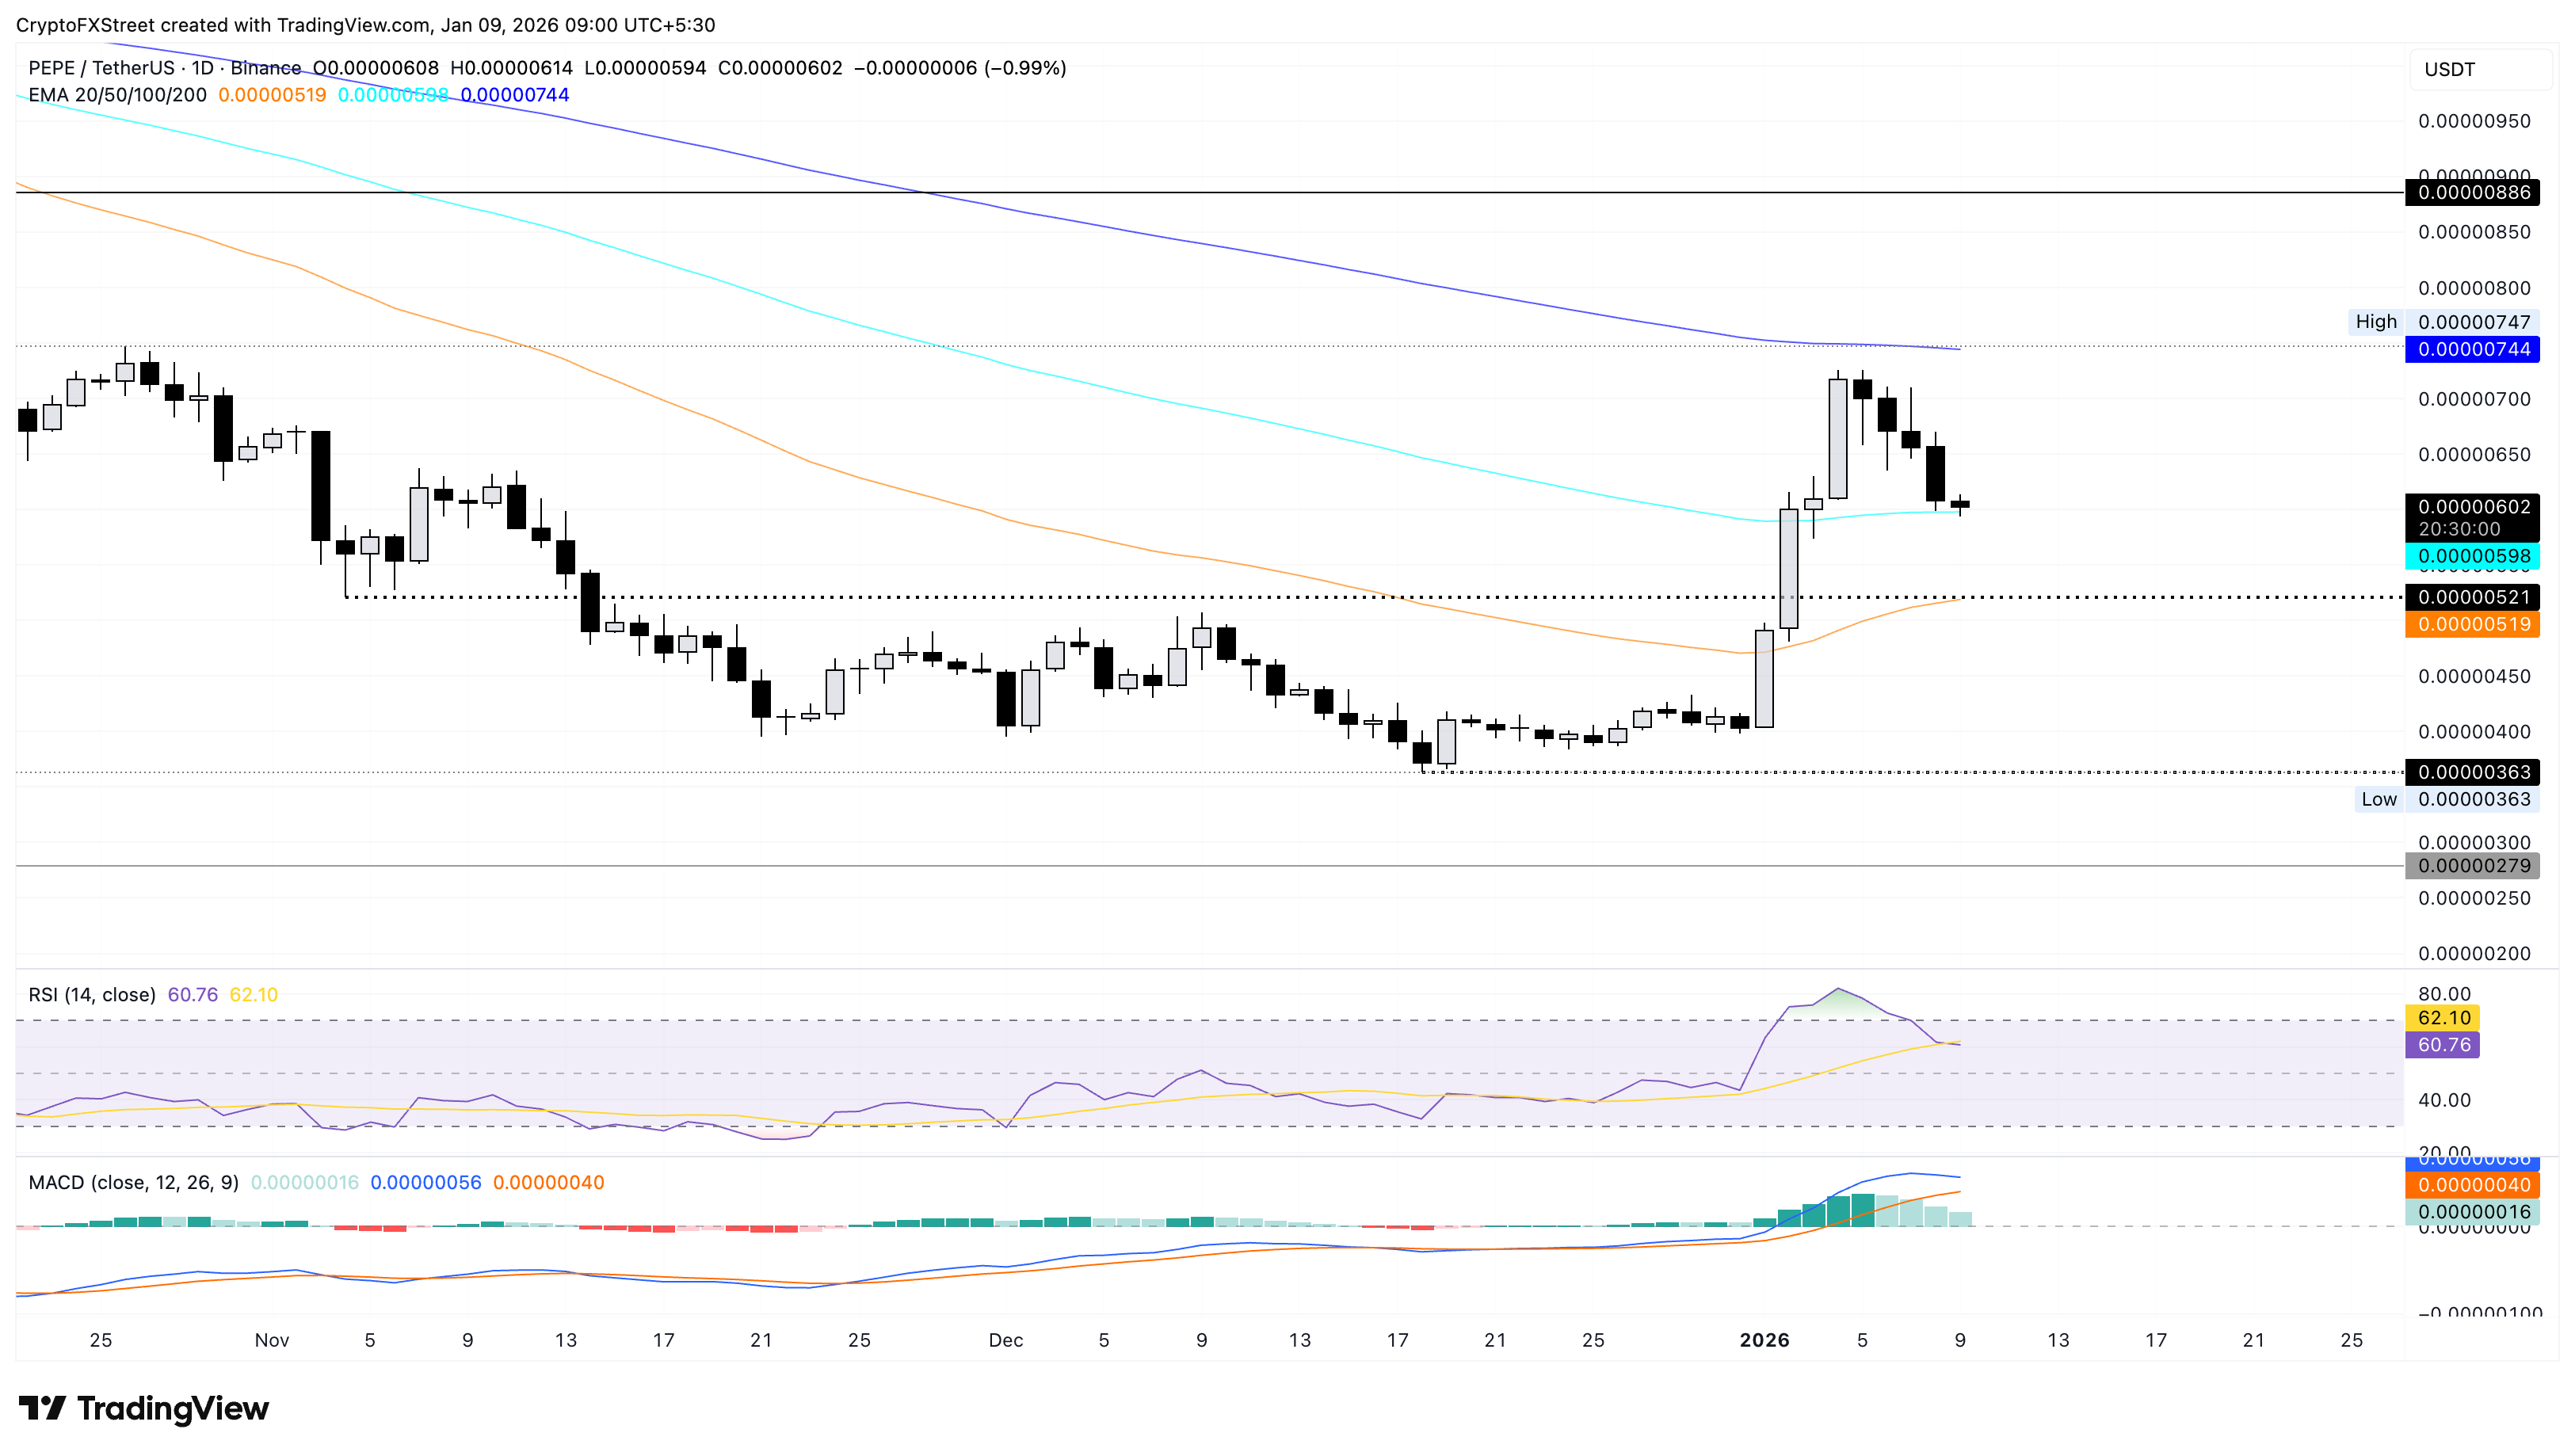
Looking up, a potential rebound in PEPE could aim for the 200-day EMA at $0.00000744.

FXStreet
Lebih dari satu juta pengguna mengandalkan FXStreet untuk data pasar real-time, alat charting, wawasan ahli, dan berita forex. Kalender ekonomi komprehensif dan webinar edukatif membantu trader tetap mendapat informasi dan membuat keputusan terukur. FXStreet memiliki sekitar 60 profesional yang tersebar antara kantor pusat Barcelona dan berbagai wilayah global.
Read More


