
Trade The World
USD/CAD Price Forecast: Moves above 1.4000, nine-day EMA due to bullish reversal potential
Oleh Akhtar Faruqui
Tanggal Diterbitkan: 24 Oct 2025 | Tanggal Dimodifikasi: 24 Oct 2025


POPULAR ARTICLES

USD/CAD extends its gains for the second successive session, trading around 1.4010 during the European hours on Friday. The technical analysis of the daily chart suggests a potential for a bullish reversal as the pair rebounds from the lower boundary of the ascending channel pattern.
- USD/CAD may explore the upside around the six-month high of 1.4079.
- The 14-day Relative Strength Index remains above the 50 mark, indicating that bullish bias is active.
- The immediate support lies at the nine-day EMA of 1.4010.
USD/CAD extends its gains for the second successive session, trading around 1.4010 during the European hours on Friday. The technical analysis of the daily chart suggests a potential for a bullish reversal as the pair rebounds from the lower boundary of the ascending channel pattern.
The short-term price momentum is neutral as the USD/CAD pair is hovering around the nine-day Exponential Moving Average (EMA). However, the 14-day Relative Strength Index (RSI) is still positioned above the 50 level, suggesting that the bullish bias is still stronger.
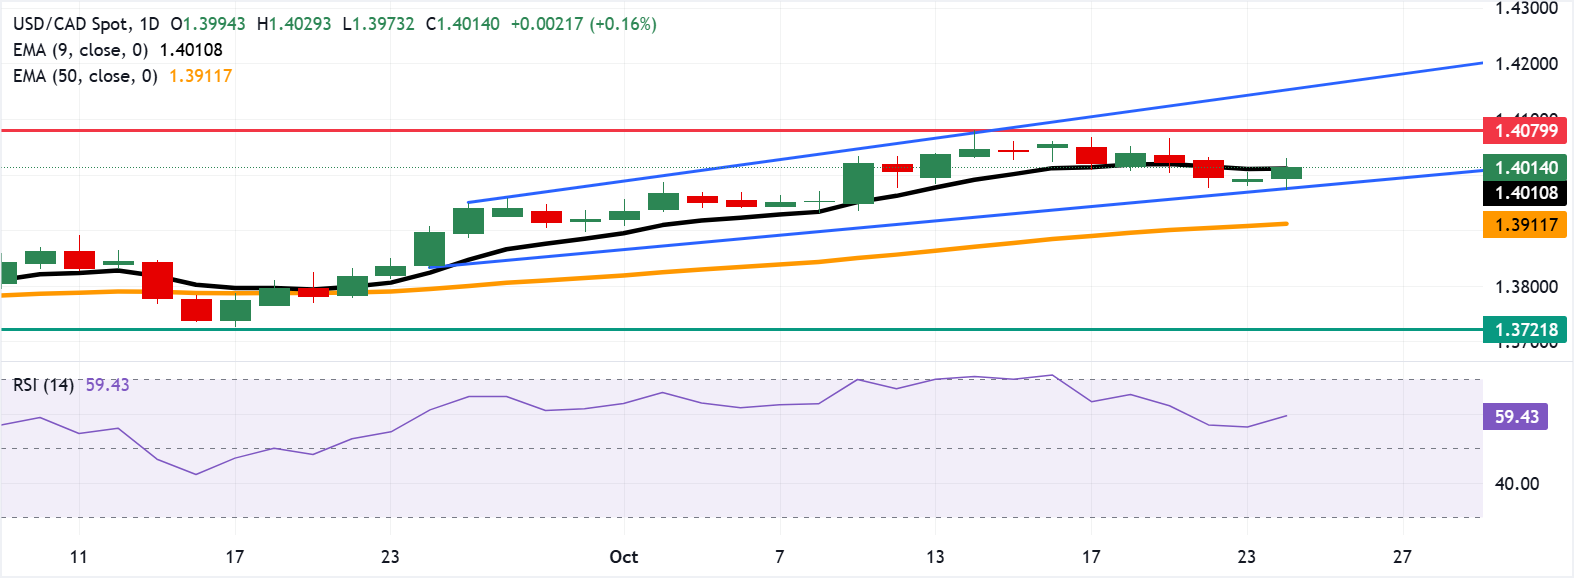
On the upside, if the USD/CAD pair successfully maintains its position above the nine-day EMA, it could strengthen the short-term price momentum and support the pair to approach the six-month high of 1.4079, reached on October 14. A break above this level would lead the pair to explore the region around the ascending channel’s upper boundary at 1.4150.
The immediate support lies at the nine-day EMA of 1.4010, followed by the psychological level of 1.4000 and the ascending channel’s lower boundary around 1.3980. Further declines below this confluence support zone would prompt the USD/CAD pair to test the 50-day EMA at 1.3911. A break below this level would weaken the medium-term price momentum and prompt the pair to navigate the region around the three-month low of 1.3721.
USD/CAD: Daily Chart
Canadian Dollar Price Today
The table below shows the percentage change of Canadian Dollar (CAD) against listed major currencies today. Canadian Dollar was the weakest against the New Zealand Dollar.
| USD | EUR | GBP | JPY | CAD | AUD | NZD | CHF | |
|---|---|---|---|---|---|---|---|---|
| USD | 0.09% | 0.00% | 0.18% | 0.15% | 0.13% | -0.02% | 0.05% | |
| EUR | -0.09% | -0.08% | 0.11% | 0.07% | 0.03% | -0.11% | -0.04% | |
| GBP | -0.01% | 0.08% | 0.16% | 0.14% | 0.12% | -0.05% | 0.03% | |
| JPY | -0.18% | -0.11% | -0.16% | -0.02% | -0.05% | -0.21% | -0.13% | |
| CAD | -0.15% | -0.07% | -0.14% | 0.02% | -0.04% | -0.19% | -0.12% | |
| AUD | -0.13% | -0.03% | -0.12% | 0.05% | 0.04% | -0.15% | -0.09% | |
| NZD | 0.02% | 0.11% | 0.05% | 0.21% | 0.19% | 0.15% | 0.07% | |
| CHF | -0.05% | 0.04% | -0.03% | 0.13% | 0.12% | 0.09% | -0.07% |
The heat map shows percentage changes of major currencies against each other. The base currency is picked from the left column, while the quote currency is picked from the top row. For example, if you pick the Canadian Dollar from the left column and move along the horizontal line to the US Dollar, the percentage change displayed in the box will represent CAD (base)/USD (quote).

FXStreet
Lebih dari satu juta pengguna mengandalkan FXStreet untuk data pasar real-time, alat charting, wawasan ahli, dan berita forex. Kalender ekonomi komprehensif dan webinar edukatif membantu trader tetap mendapat informasi dan membuat keputusan terukur. FXStreet memiliki sekitar 60 profesional yang tersebar antara kantor pusat Barcelona dan berbagai wilayah global.
Read More


