


What are Indices?
Indices measure the price performance of a group of shares from an exchange — the foundation of index trading (often called indices trading). For example, the FTSE 100 tracks the 100 largest companies on the London Stock Exchange (LSE), while the S&P 500 (SPX) represents 500 large-cap companies in the United States.
Trading indices enables you to gain exposure to an entire economy or sector with a single position, offering a more diversified approach than trading individual stocks. Indices are highly liquid markets with extended trading hours, providing more opportunities to capitalize on market movements.
Key Benefits of Indices Trading
Gain broad market exposure without buying individual stocks
Trade on the collective performance of major companies
Access highly liquid markets with extended trading hours
Implement diversification strategies more efficiently
Reduce company-specific risk while maintaining market exposure
How are Stock Market Indices Calculated?
Most stock market indices are calculated according to the market capitalization of their component companies. This method gives greater weighting to larger-cap companies, meaning their performance will affect an index's value more than that of lower-cap companies.
Calculation Methods
Market Capitalization-Weighted: The most common method where companies with larger market caps have more influence on the index (e.g., S&P 500, FTSE 100)
Price-Weighted: Companies with higher share prices have greater weighting regardless of company size (e.g., Dow Jones Industrial Average)
Equal-Weighted: All companies have the same influence regardless of size or share price.
Float-Adjusted: Only considers shares available for public trading, excluding closely held shares.
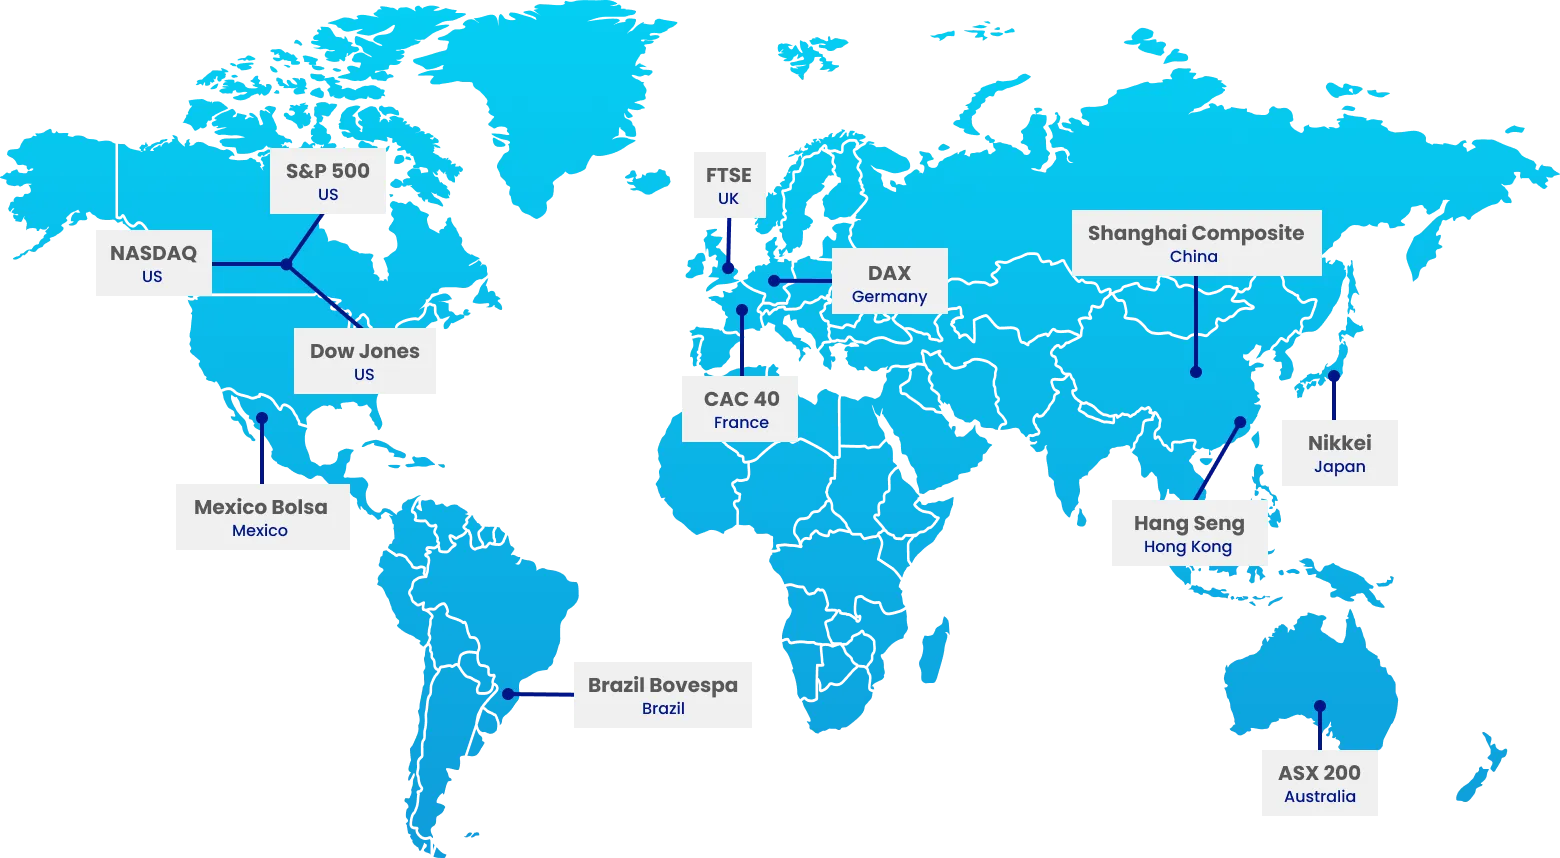
Most Traded Indices Worldwide
Major Global Indices
DJIA (Wall Street): Measures the value of the 30 largest blue-chip stocks in the US
S&P 500 (US 500): Tracks the value of 500 large-cap companies in the US
NASDAQ 100 (US Tech 100): Reports the market value of the 100 largest non-financial companies in the US
FTSE 100: Measures the performance of 100 blue-chip companies listed on the London Stock Exchange
DAX (Germany 40): Tracks the performance of the 40 largest companies listed on the Frankfurt Stock Exchange
Nikkei 225: Japan's premier index, representing 225 large, publicly traded Japanese companies
Hang Seng Index: Reflects the performance of the largest companies listed in Hong Kong
What Moves an Index's Price?
An index's price can be affected by a range of factors, and understanding these can help you make more informed trading decisions:
Economic Factors
Economic News: Investor sentiment, central bank announcements, payroll reports or other economic events (see the economic calendar) can affect underlying volatility
Interest Rate Changes: Central bank decisions on interest rates can significantly impact stock markets
Inflation Data: Higher-than-expected inflation may lead to market declines due to potential monetary tightening
GDP Reports: Strong economic growth typically supports higher index values — track key releases via the Acuity Economic Calendar
Corporate Factors
Company Financial Results: Individual company profits and losses will cause share prices to increase or decrease, affecting an index's price — monitor earnings on the Corporate Calendar
Company Announcements: Changes to company leadership or possible mergers will likely affect share prices, which can have either a positive or negative effect on an index's price — analyze with Trading Central tools
Earnings Seasons: Quarterly reporting periods can create increased volatility in indices — see day trading explained
Structural Factors
Changes to an Index's Composition: Weighted indices can see their prices shift when companies are added or removed, as traders adjust their positions to account for the new composition
Rebalancing Periods: Regular adjustments to index components can create temporary price fluctuations
Commodity Prices
Various commodities will affect different indices' prices. For example, 15% of the shares listed on the FTSE 100 are commodity stocks, meaning fluctuations in the commodity market could affect the index's price.
Energy-heavy indices like Russia's RTS are particularly sensitive to oil price movements.
Geopolitical Events
International conflicts, trade disputes, elections, and policy changes can drive significant index movements, which you can track via Acuity NewsIQ.
Market sentiment often shifts rapidly during periods of geopolitical uncertainty — Acuity Signal can help visualize these shifts.
Why Trade Indices?
By using indices as a trading vehicle, you can access several key advantages:
Immediate Exposure to an Entire Market
A primary advantage of index trading is the sheer breadth of market exposure accessed in a single position. Instead of analyzing and buying dozens or hundreds of individual stocks, one indices trade exposes you to an entire economy or sector.
[Explore 15+ indices available for trading with TMGM]
Directional Trading Opportunities
When trading indices with CFDs through TMGM, you can go both long and short:
Going Long: Buying a market because you expect the price to rise
Going Short: Selling a market because you expect the price to fall — learn more about short selling
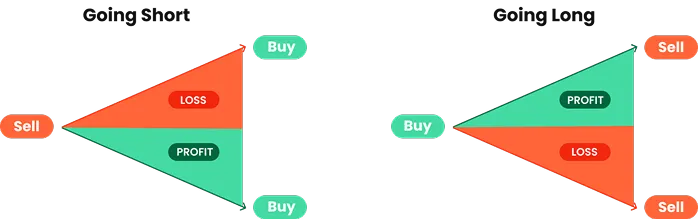
This flexibility means you can profit whether markets rise or fall, giving you more trading opportunities across different market conditions.
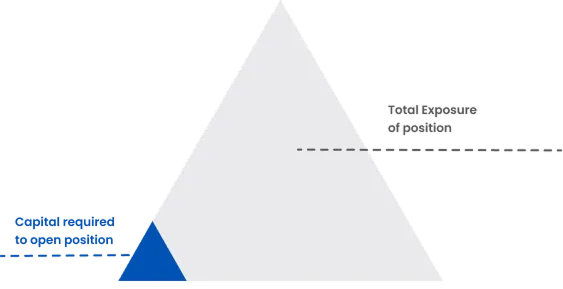
Leveraged Trading
CFDs are leveraged products, meaning you only need to commit an initial deposit – known as margin – to open a position that gives you much larger market exposure. This amplifies potential profits and losses, so proper risk management is essential.
Hedging Capabilities
Indices serve as effective hedging tools for managing portfolio risk. Investors holding a diversified stock portfolio can short an index to mitigate potential losses during market downturns. Conversely, traders with multiple short positions on individual stocks may use a long position on an index to offset unexpected gains in certain equities.
Additionally, sector-specific indices enable more precise hedging by providing exposure to specific industries, allowing traders to protect against volatility within targeted market segments.
How to Trade Indices with TMGM
Choose Your Trading Approach
With TMGM, you can trade indices via Contracts for Difference (CFDs), which are financial derivatives that allow you to speculate on price movements without owning the underlying assets.
CFD Benefits
Go long or short on index movements
Trade with leverage to control larger positions with smaller capital
No ownership of underlying assets required
Commission-free trading with competitive spreads
Access to advanced trading platforms and tools
Indices Trading Strategies
Successful indices trading requires a well-defined strategy aligned with your trading style and goals.
Trend Following
Identify and trade in the direction of established market trends
Use moving averages, trendlines, and momentum indicators to confirm trend direction
Enter on pullbacks or breakouts in the trend direction
Popular for major indices that tend to exhibit strong trending behavior
News-Based Trading
Capitalize on scheduled economic releases and central bank announcements
React to unexpected geopolitical events or major corporate news
Requires quick execution and sound risk management
It is best implemented when you have a thorough understanding of how specific news affects different indices
Sector Rotation
Shift exposure between different sector indices based on economic cycle positioning.
Emphasize defensive sectors (utilities, consumer staples) during economic downturns.
Focus on cyclical sectors (technology, consumer discretionary) during expansions.
Requires macro-economic analysis and sector correlation understanding
Intermarket Analysis
Analyze relationships between indices, currencies, commodities, and bonds
Identify leading indicators that typically move before major index shifts
Trade correlations and divergences between related markets
Example: A strengthening USD often correlates with weakening US indices
Technical Analysis Approaches
Support and Resistance: Identify key price levels where indices typically reverse
Chart Patterns: Trade formations like head and shoulders, double tops/bottoms, or triangles
Fibonacci Retracements: Use Fibonacci levels to identify potential reversal points
Volume Analysis: Confirm price movements with corresponding volume patterns
Risk Management for Indices Trading
Proper risk management is essential for long-term success in indices trading.
Position Sizing
Effective risk management starts with determining the right position size for each trade, typically limiting risk to 1–2% of total trading capital. Position size should be calculated based on stop-loss placement — try the Trading Calculator — ensuring that losses remain manageable.
Traders should adjust their size for high-volatility indices or during periods of significant news events. Additionally, considering the correlation between positions can help avoid excessive exposure to a single market movement when trading multiple indices.
Stop-Loss Strategies
Stop-loss orders help mitigate risk, but their effectiveness depends on the type used. Normal stops are free but may be subject to slippage during sharp price moves. Guaranteed stops ensure execution at the specified price, even during market gaps, though they come with a fee if triggered.
Trailing stops are helpful in securing profits by moving with favorable price action while maintaining downside protection. Choosing the right stop-loss strategy can improve trade management and risk control.
Diversification Approaches
Diversifying index trading helps manage risk and improve consistency. Traders can trade indices from different geographic regions to spread exposure across markets. A balanced approach between developed and emerging markets can provide stability while capturing growth potential.
Understanding correlations between indices allows traders to avoid excessive concentration in a single market. Mixing different trading styles and timeframes can help create a well-rounded strategy.
Managing Leverage
Leverage can amplify both profits and losses, making responsible usage essential. Traders should use lower leverage during volatile market conditions to reduce risk exposure.
It's important never to risk more than what can be afforded to lose, ensuring financial sustainability. Instead of increasing leverage, traders should consider reducing position size to manage risk effectively while maintaining control over their portfolio.
Advantages of Trading Indices with TMGM
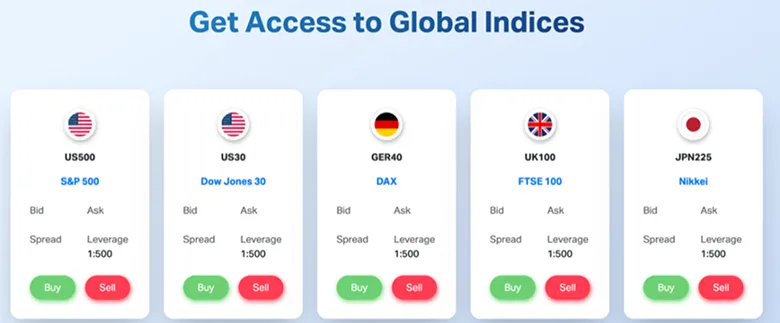
TMGM offers Indices CFDs, allowing traders to speculate on the performance of major global stock indices without owning the underlying assets. Traders can access over 15 major indices, including the US500 (S&P 500), US30 (Dow Jones 30), GER40 (DAX 40), UK100 (FTSE 100), and JPN225 (Nikkei 225). With leverage up to 1:500, tight spreads starting from 0.1 pips, and zero commission trading, TMGM provides a cost-effective way to trade indices.
These CFDs are based on the spot price, offering real-time market exposure. Positions held overnight may incur funding charges, making them more suited for short- to medium-term trading strategies.
Traders can execute trades on MetaTrader 4 (MT4) and MetaTrader 5 (MT5), benefiting from advanced charting tools and market analysis features. Visit our official website for a detailed overview of TMGM’s indices offerings and trading conditions.
Step-by-Step Trading Process
Create an Account: Open a trading account with TMGM
Choose Your Platform: Access markets through MetaTrader 4, MetaTrader 5, or other available platforms
Select an Index: Choose from major indices like the S&P 500, NASDAQ, or FTSE 100
Determine Direction: Decide whether to go long (buy) or short (sell) based on your market analysis
Set Position Size: Determine how much to invest, considering leverage and risk management
Apply Risk Management: Set stop-loss and take-profit orders to manage potential losses and lock in gains
Execute Your Trade: Open your position through the trading platform
Monitor and Adjust: Track market movements and adjust your position as needed
Close Your Position: Exit the trade when your target is reached or to limit losses.


