
GBP/JPY Price Forecast: Slides from yearly highs, towards 212.00
Di Christian Borjon Valencia
Data di Pubblicazione: 16 Jan 2026 | Data di Modifica: 16 Jan 2026


ARTICOLI POPOLARI

The British Pound drops versus the Japanese Yen as the Friday’s Asian session begins, courtesy of Japanese authorities’ verbal intervention, which boosted the Asian currency. The GBP/JPY trades at 212.20 after falling from yearly highs near 214.30.
- GBP/JPY retreats from 214.30 as verbal intervention by Japanese authorities strengthens the Yen.
- Bearish candlestick patterns and falling RSI signal a short-term momentum shift lower.
- A break below 212.00 targets 211.42 and 210.00, while 213.31 caps near-term upside.
The British Pound drops versus the Japanese Yen as the Friday’s Asian session begins, courtesy of Japanese authorities’ verbal intervention, which boosted the Asian currency. The GBP/JPY trades at 212.20 after falling from yearly highs near 214.30.
GBP/JPY Price Forecast: Technical outlook
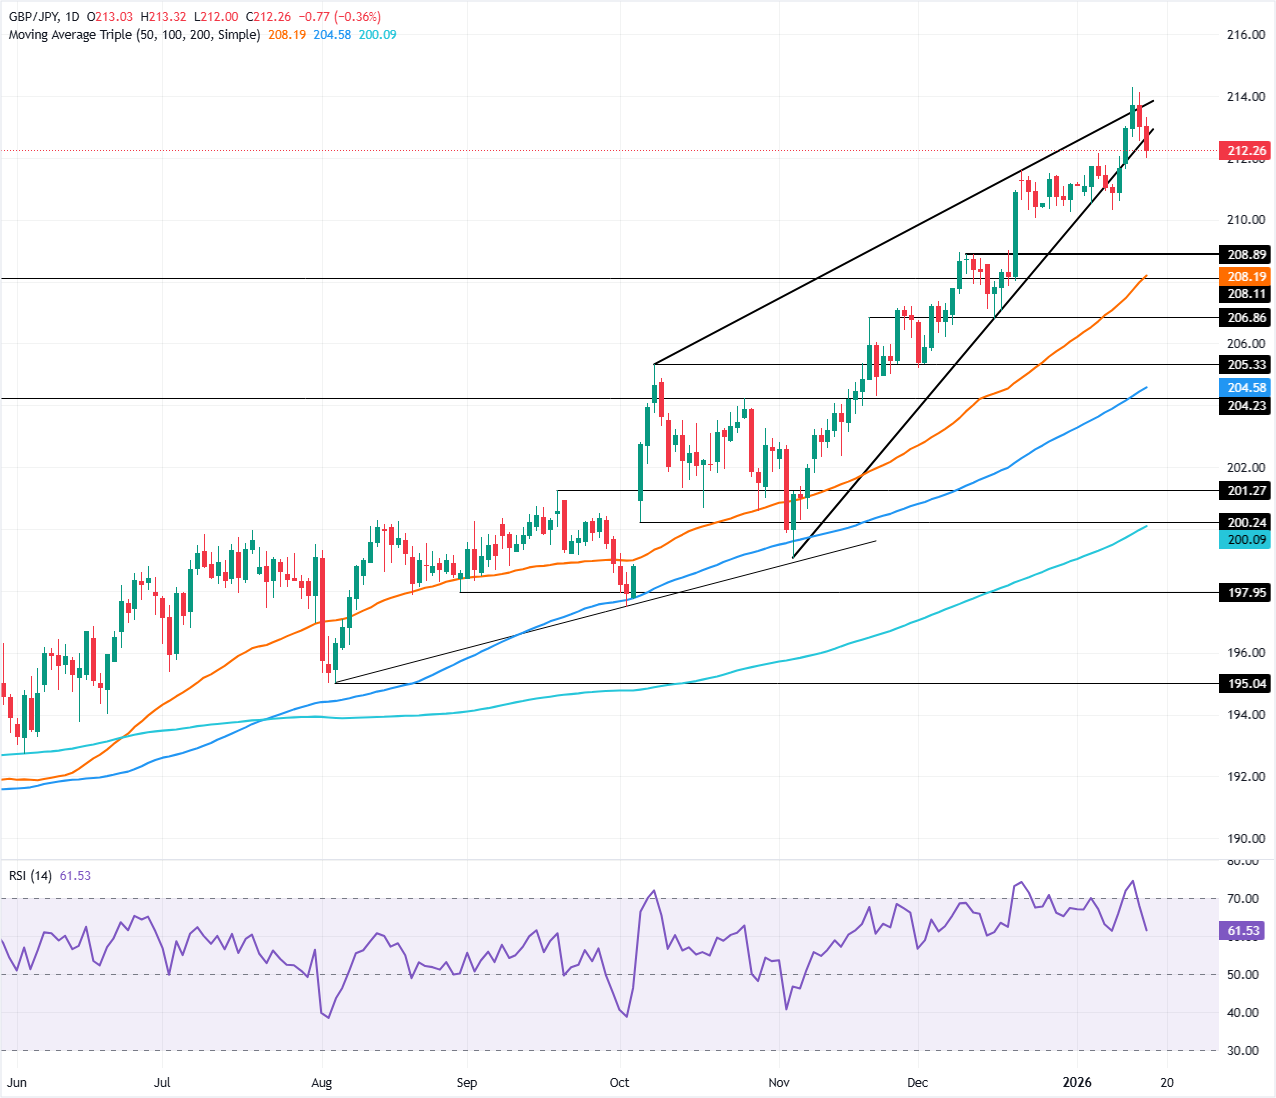
The technical picture shows that the GBP/JPY uptrend is poised to continue, despite the ongoing pullback. It should be said that the pair dipped as a ‘bearish harami’ two candle pattern emerged near yearly highs, followed by a subsequent bearish candle that pushed the cross to new three-day lows of 212.00.
Momentum favors sellers as the Relative Strength Index (RSI) retreated from overbought territory, triggering a sell signal.
If GBP/JPY extends its losses decisively below 212.00, then it could challenge the 20-day SMA at 211.42. Once surpassed, traders will eye 210.00.
Conversely, if the cross-pair rises past the January 15 high of 213.31, the next key resistance would be the yearly peak at 214.29.
GBP/JPY Price Char — Daily
Japanese Yen Price This week
The table below shows the percentage change of Japanese Yen (JPY) against listed major currencies this week. Japanese Yen was the strongest against the Swiss Franc.
| USD | EUR | GBP | JPY | CAD | AUD | NZD | CHF | |
|---|---|---|---|---|---|---|---|---|
| USD | 0.20% | 0.14% | 0.30% | -0.19% | -0.29% | -0.24% | 0.31% | |
| EUR | -0.20% | -0.07% | 0.18% | -0.39% | -0.48% | -0.43% | 0.10% | |
| GBP | -0.14% | 0.07% | 0.23% | -0.32% | -0.42% | -0.36% | 0.18% | |
| JPY | -0.30% | -0.18% | -0.23% | -0.52% | -0.63% | -0.56% | -0.02% | |
| CAD | 0.19% | 0.39% | 0.32% | 0.52% | -0.12% | -0.04% | 0.50% | |
| AUD | 0.29% | 0.48% | 0.42% | 0.63% | 0.12% | 0.06% | 0.60% | |
| NZD | 0.24% | 0.43% | 0.36% | 0.56% | 0.04% | -0.06% | 0.52% | |
| CHF | -0.31% | -0.10% | -0.18% | 0.02% | -0.50% | -0.60% | -0.52% |
The heat map shows percentage changes of major currencies against each other. The base currency is picked from the left column, while the quote currency is picked from the top row. For example, if you pick the Japanese Yen from the left column and move along the horizontal line to the US Dollar, the percentage change displayed in the box will represent JPY (base)/USD (quote).

Acuity Trading è una fintech con sede a Londra, fondata nel 2013, specializzata in dati alternativi basati su AI e analisi del sentiment per il trading e gli investimenti. Ha rivoluzionato l’esperienza di trading online con strumenti visivi di notizie e sentiment e continua a guidare il mercato con dati alternativi che generano alfa e strumenti di trading altamente coinvolgenti sfruttando le più recenti ricerche e tecnologie AI.
Leggi di più


