
XRP stalls below resistance amid rising ETF inflows and futures market strength
Di John Isige
Data di Pubblicazione: 14 Jan 2026 | Data di Modifica: 14 Jan 2026


ARTICOLI POPOLARI

Ripple (XRP) is trading down to $2.15 at the time of writing on Wednesday after posting a brief rally the previous day. The uptrend, fueled by improved market sentiment after the US reported lower-than-expected core inflation in December, reached $2.19 before the ongoing correction.
- XRP uptrend takes a breather below resistance at $2.21 while the 50-day EMA offers support at $2.08.
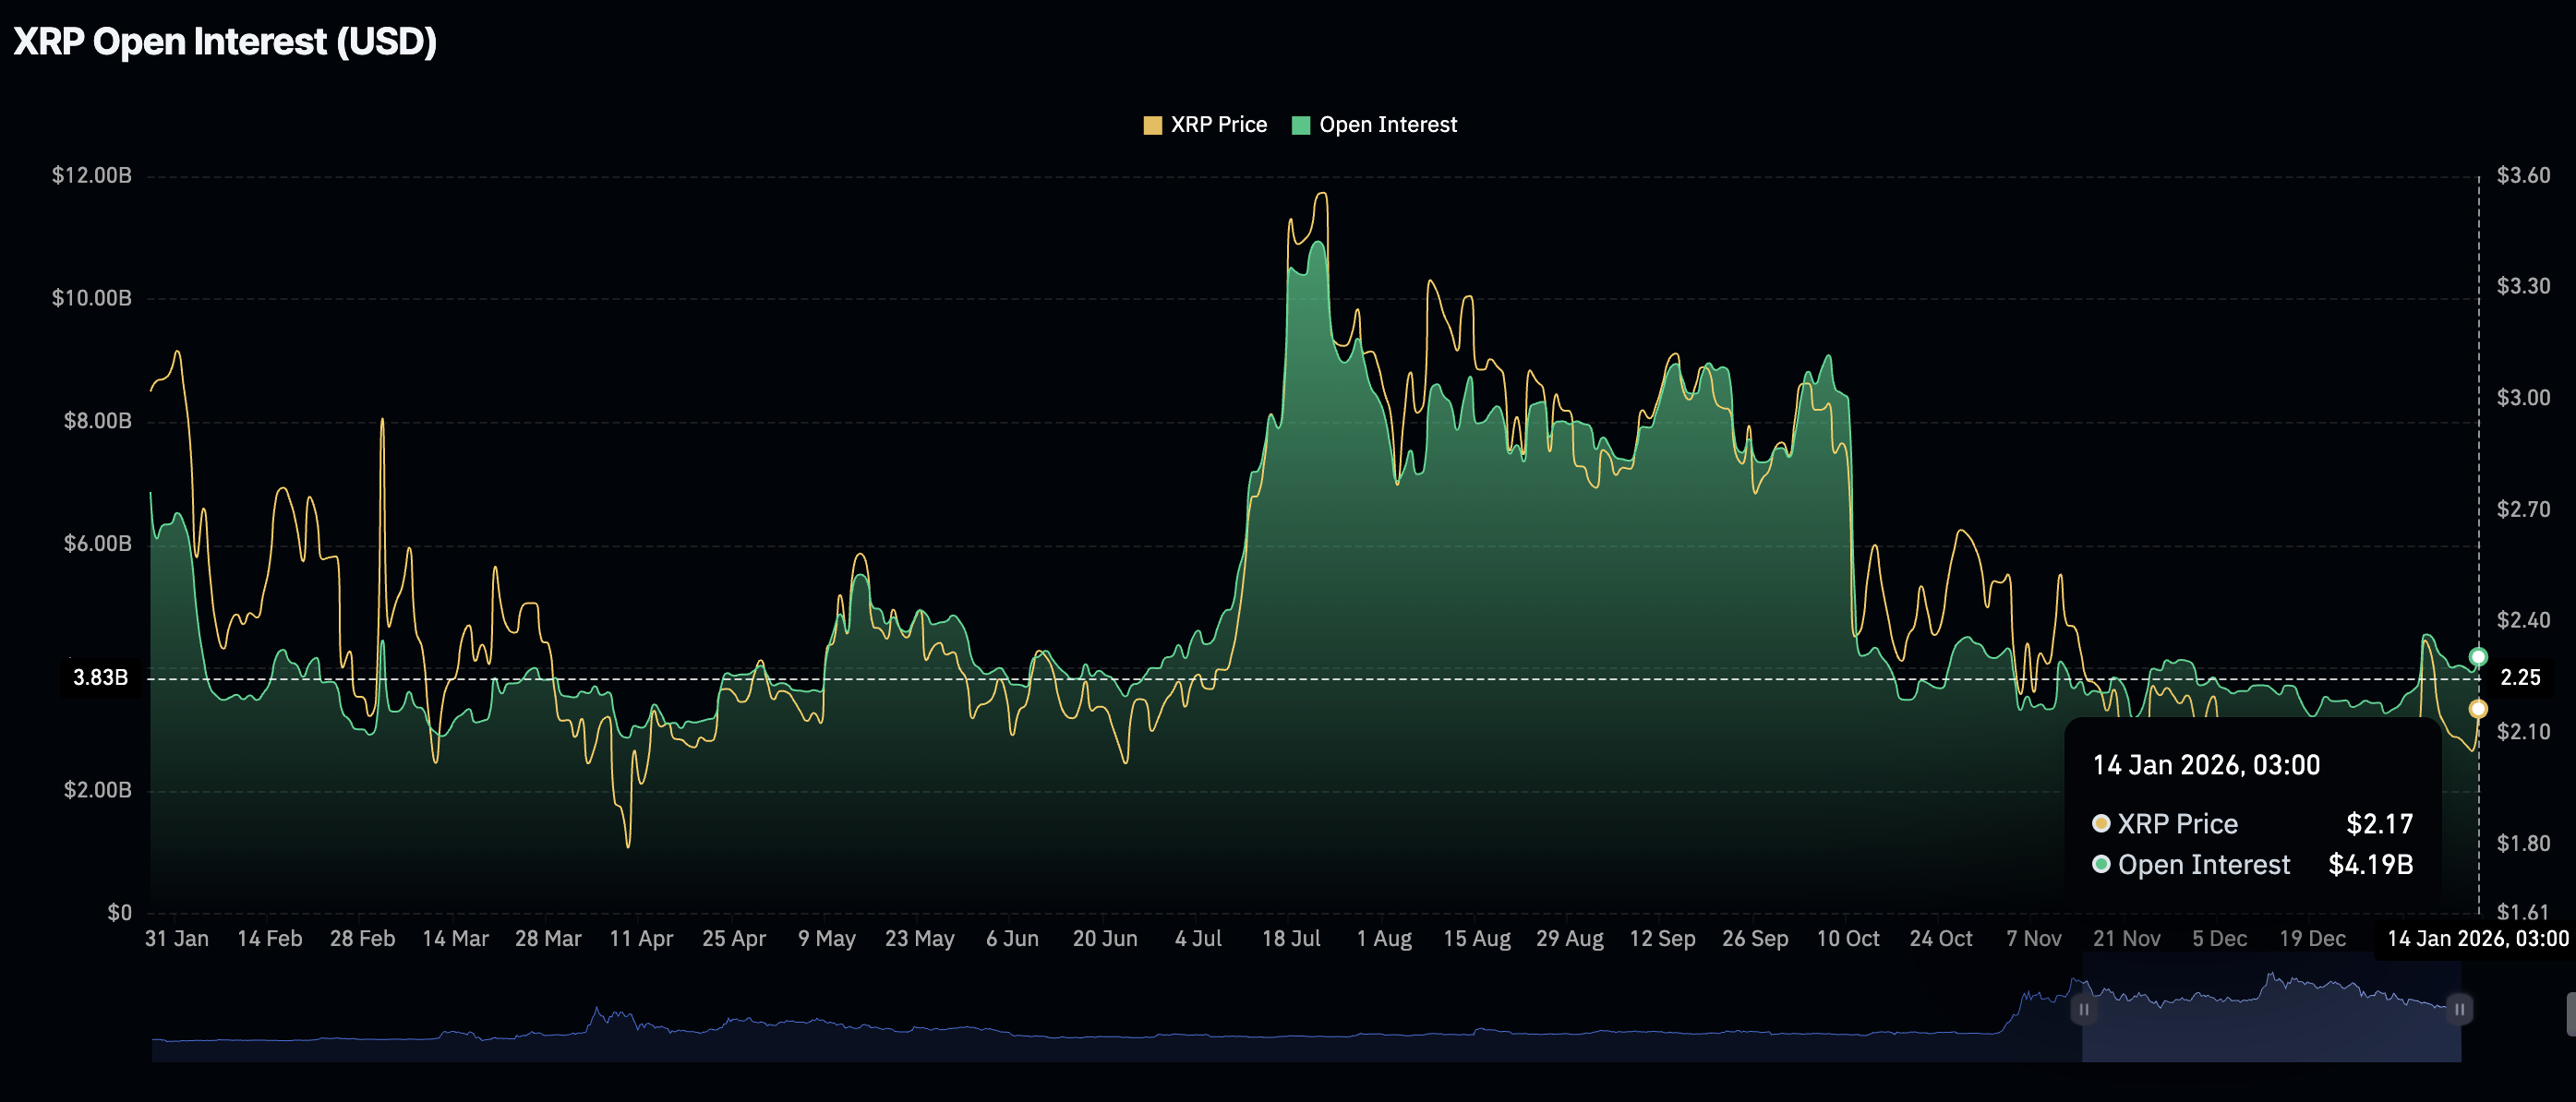
- The derivatives market shows strength, with futures Open Interest rebounding to $4.19 billion.
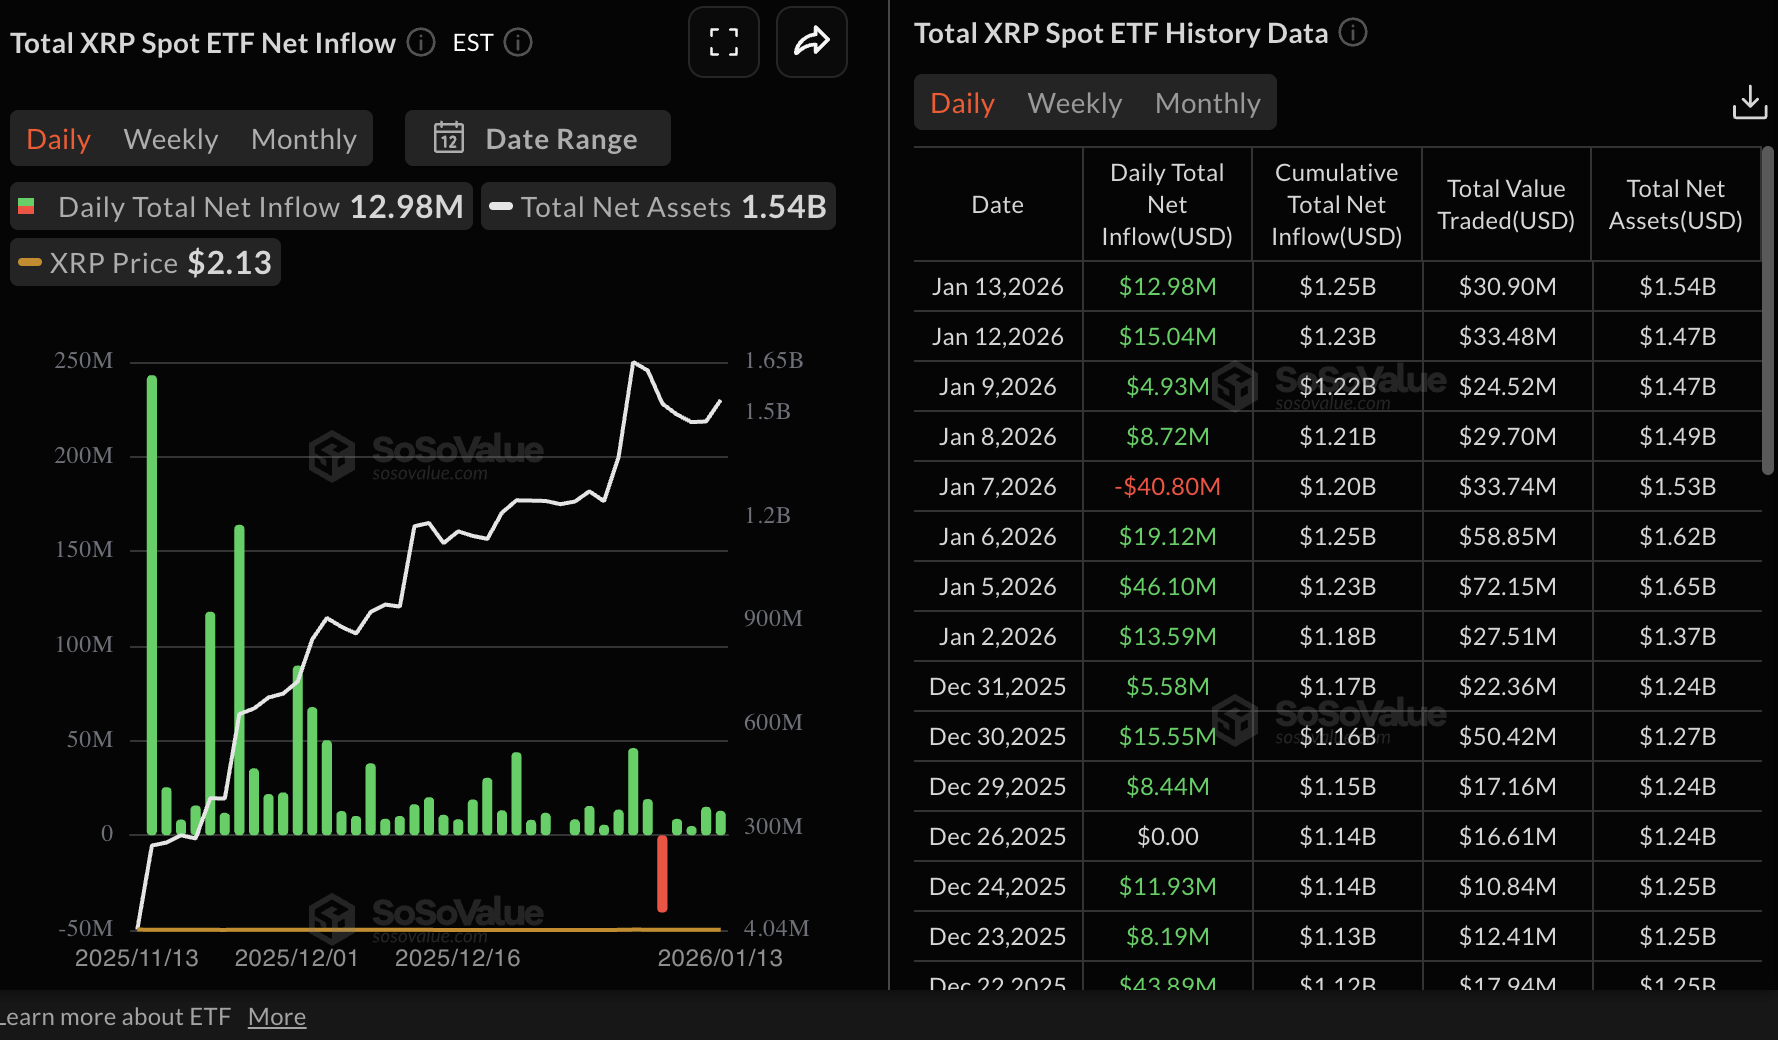
- XRP ETF recorded $13 million in inflows on Tuesday, led by Grayscale’s GXRP.
Ripple (XRP) is trading down to $2.15 at the time of writing on Wednesday after posting a brief rally the previous day. The uptrend, fueled by improved market sentiment after the US reported lower-than-expected core inflation in December, reached $2.19 before the ongoing correction.
Retail and institutional investors drive XRP demand
Retail interest in XRP is rising again, as reflected in futures Open Interest (OI), which averages $4.19 billion on Wednesday, up from $3.93 billion the previous day. The increase, albeit minor, suggests that investors are beginning to lean more into risk.
If this trend continues in the OI, representing the notional value of outstanding futures contracts, XRP could regain momentum to push for a short-term breakout toward $3.00.
Still, the OI sits below the yearly high of $4.55 billion, recorded on January 6, underscoring the need for traders to temper their expectations in the short term.
Meanwhile, interest in XRP spot Exchange Traded Funds (ETFs) continues to build, as SoSoValue reports nearly $13 million in inflows on Tuesday. Since their launch in November, XRP ETFs have recorded just one outflow, totaling nearly $41 million on January 7. The cumulative inflow now stands at $1.25 billion with net assets at $1.54 billion.
Technical outlook: Can XRP resume its uptrend?
XRP is trading between a key support provided by the 50-day Exponential Moving Average (EMA) at $2.08 and the 100-day EMA at $2.21 at the time of writing on Wednesday.
The cross-border money remittance token is down over 1%, indicating early profit-taking after Tuesday's rally. A minor decline in the Relative Strength Index (RSI) to 57 on the daily chart confirms the buildup of downside pressure. If the RSI continues to fall, XRP could extend its correction toward the 50-day EMA.
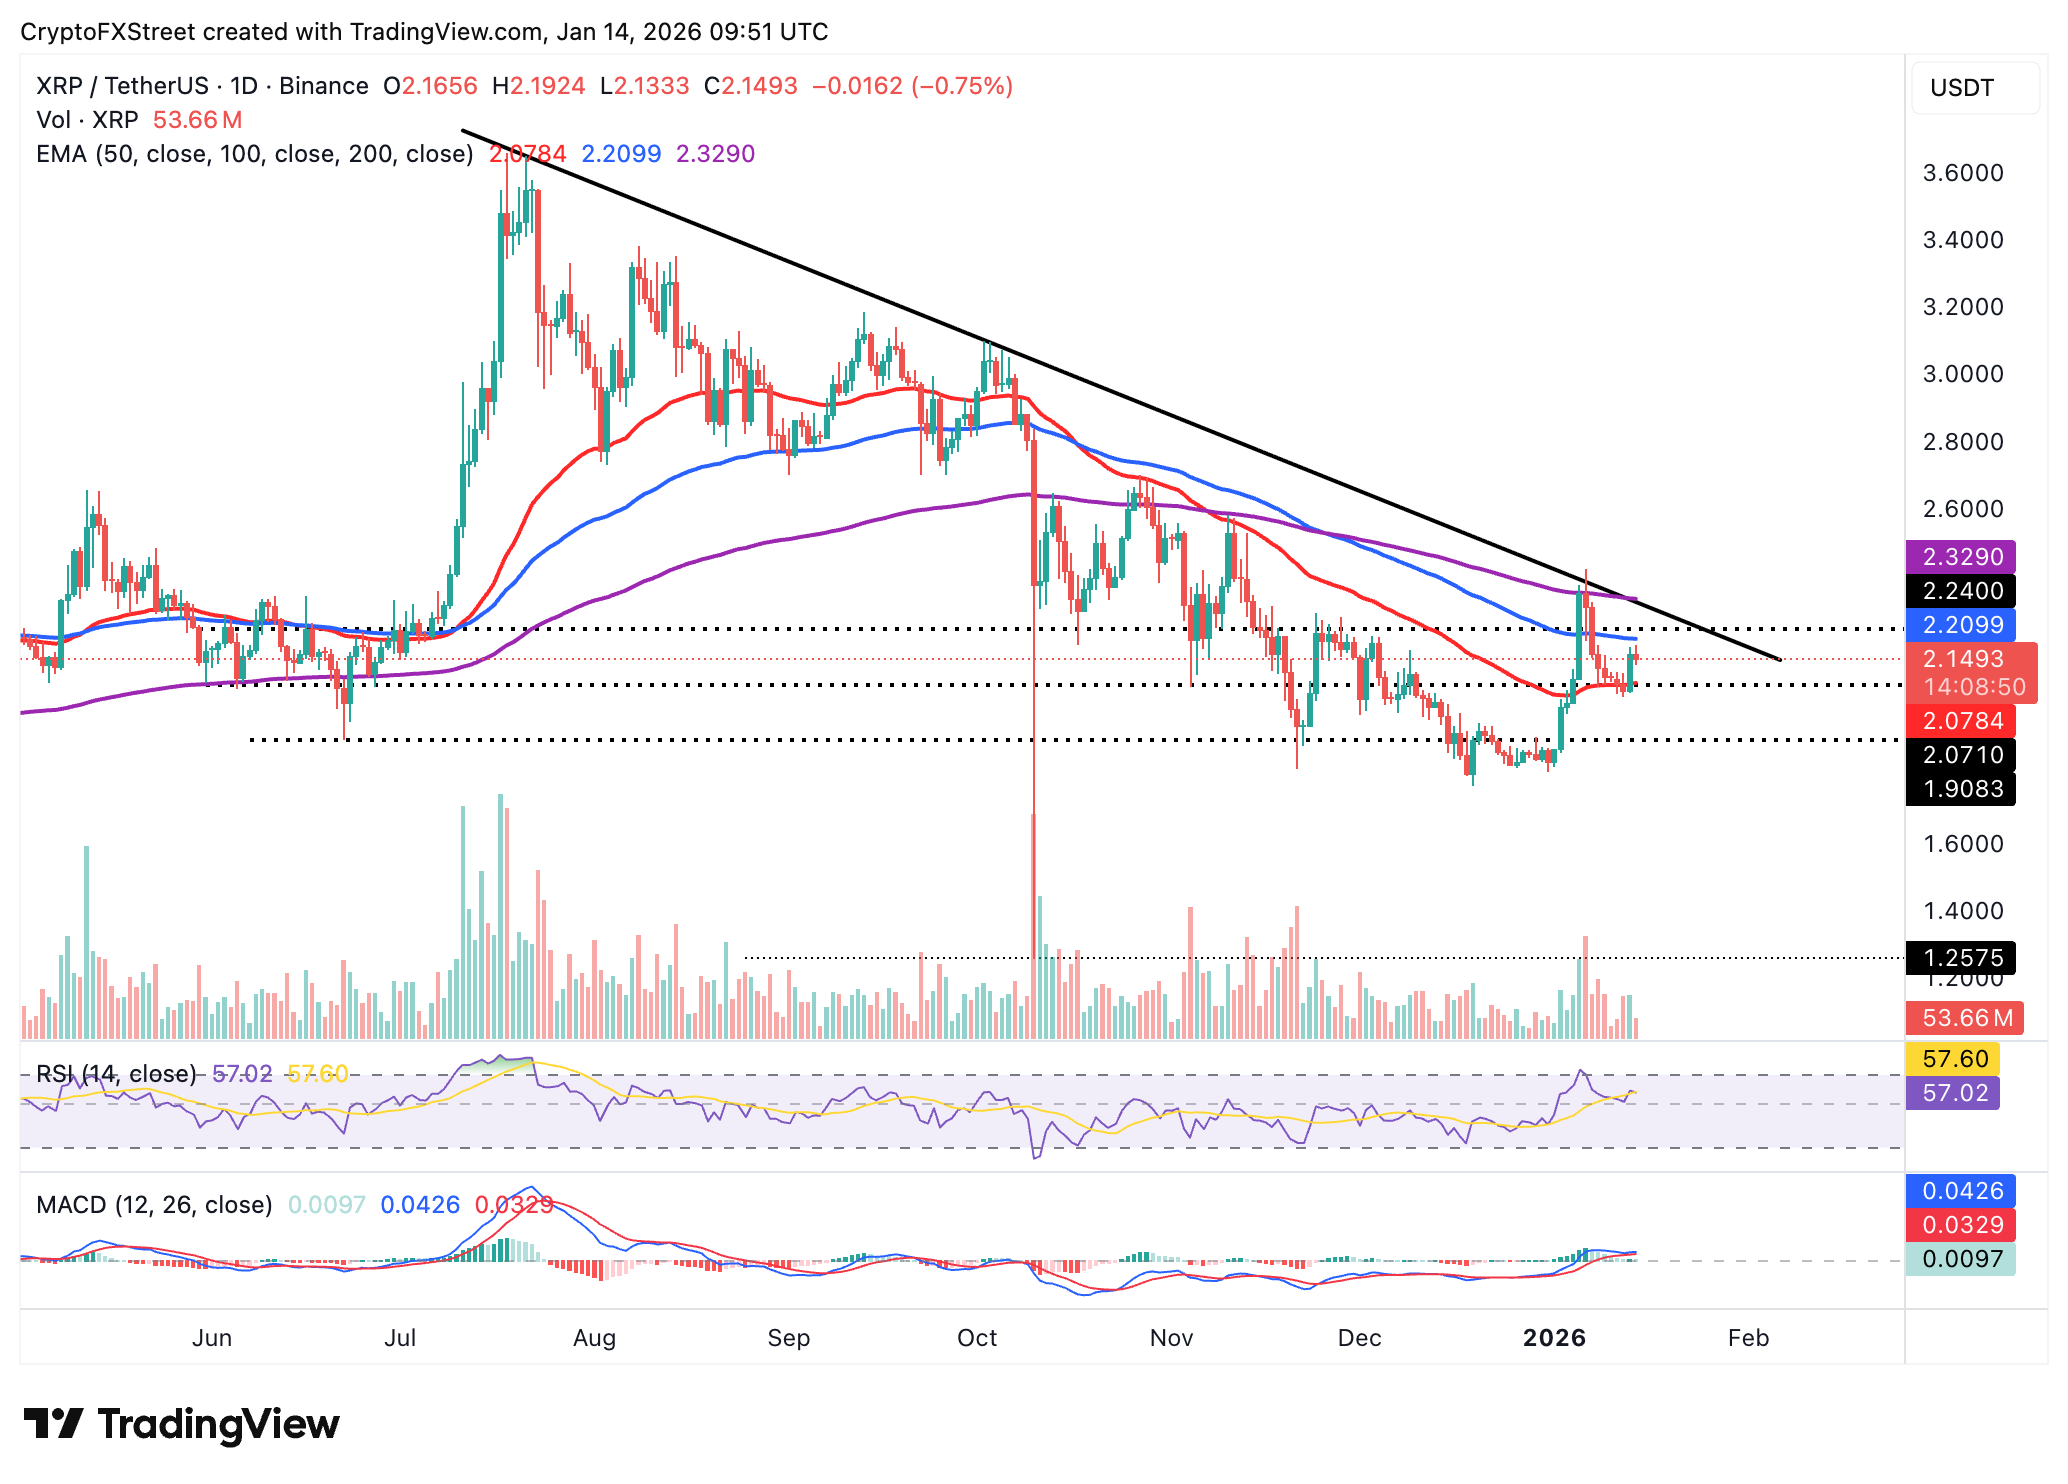
Looking ahead, the Moving Average Convergence Divergence (MACD) indicator on the same chart holds above the signal line, which may prompt investors to increase their risk exposure.
The green histogram above the mean line should continue to expand, reinforcing bullish momentum and increasing the odds of a breakout. A close above the 100-day EMA at $2.21 could accelerate the uptrend toward the 200-day EMA ($2.33) and the descending trendline resistance.
Open Interest, funding rate FAQs
Higher Open Interest is associated with higher liquidity and new capital inflow to the market. This is considered the equivalent of increase in efficiency and the ongoing trend continues. When Open Interest decreases, it is considered a sign of liquidation in the market, investors are leaving and the overall demand for an asset is on a decline, fueling a bearish sentiment among investors.
Funding fees bridge the difference between spot prices and prices of futures contracts of an asset by increasing liquidation risks faced by traders. A consistently high and positive funding rate implies there is a bullish sentiment among market participants and there is an expectation of a price hike. A consistently negative funding rate for an asset implies a bearish sentiment, indicating that traders expect the cryptocurrency’s price to fall and a bearish trend reversal is likely to occur.

Acuity Trading è una fintech con sede a Londra, fondata nel 2013, specializzata in dati alternativi basati su AI e analisi del sentiment per il trading e gli investimenti. Ha rivoluzionato l’esperienza di trading online con strumenti visivi di notizie e sentiment e continua a guidare il mercato con dati alternativi che generano alfa e strumenti di trading altamente coinvolgenti sfruttando le più recenti ricerche e tecnologie AI.
Leggi di più


