
Trade The World
SPX6900 Price Forecast: SPX slips 13% as derivatives data show bearish bias
Di Manish Chhetri
Data di Pubblicazione: 3 Nov 2025 | Data di Modifica: 3 Nov 2025


POPULAR ARTICLES
SPX6900 (SPX) extends its decline, trading below $0.77 at the time of writing on Monday after falling 22% in the previous week. The derivatives data projects a bearish sentiment, with SPX’s Open Interest (OI) falling and bearish bets rising among traders.
- SPX6900 price slips below $0.77 on Monday after falling over 22% in the previous week.
- Derivatives data show falling Open Interest and rising bearish positions, suggesting growing downside pressure.
- The technical outlook suggests weakness, with bears targeting a drop toward $0.63.
SPX6900 (SPX) extends its decline, trading below $0.77 at the time of writing on Monday after falling 22% in the previous week. The derivatives data projects a bearish sentiment, with SPX’s Open Interest (OI) falling and bearish bets rising among traders. The technical side further supports a bearish outlook, suggesting that SPX6900 could extend its decline toward $0.63 level.
SPX6900 drops amid rising bearish signals in the derivatives market
Derivatives metrics for SPX6900 show a bearish bias. CoinGlass’s long-to-short ratio for SPX at 0.83 on Monday, the lowest level in over a month, rising bearish bets among traders.
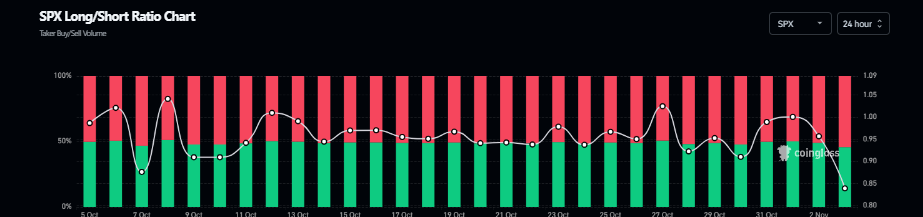
SPX long-to-short ratio chart. Source: Coinglass
Coinglass’s futures Open Interest for the SPX meme coin drops to $9.30 million on Monday, compared to $18.96 million on October 7. This drop in OI, which has been falling since July, signals waning investor participation and reinforces a weakening market sentiment for the SPX meme coin.
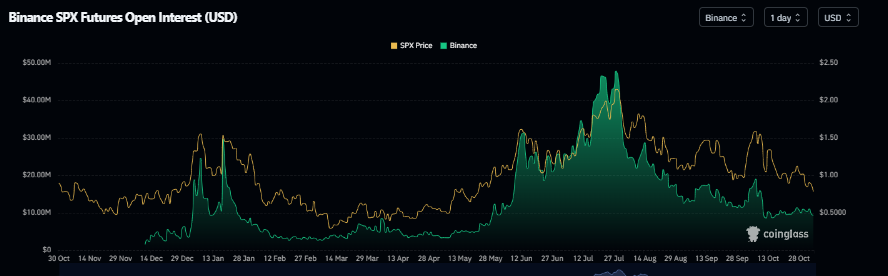
SPX open interest chart. Source: Coinglass
SPX6900 Price Forecast: SPX drops 13% as bears take control of momentum
SPX6900 price corrected by more than 22% in the previous week after being rejected around the 50-day Exponential Moving Average (EMA) at $1.11 and retested the May 27 low at $0.81. At the time of writing on Monday, SPX extends its correction by 13% trading at $0.75.
If SPX continues its correction, it could extend the correction toward the daily support at $0.63.
The Relative Strength Index (RSI) on the daily chart is 35, below the neutral 50 level, indicating strong bearish momentum. Additionally, the Moving Average Convergence Divergence (MACD) showed a bearish crossover last week, which remains in effect, further supporting the bearish view.
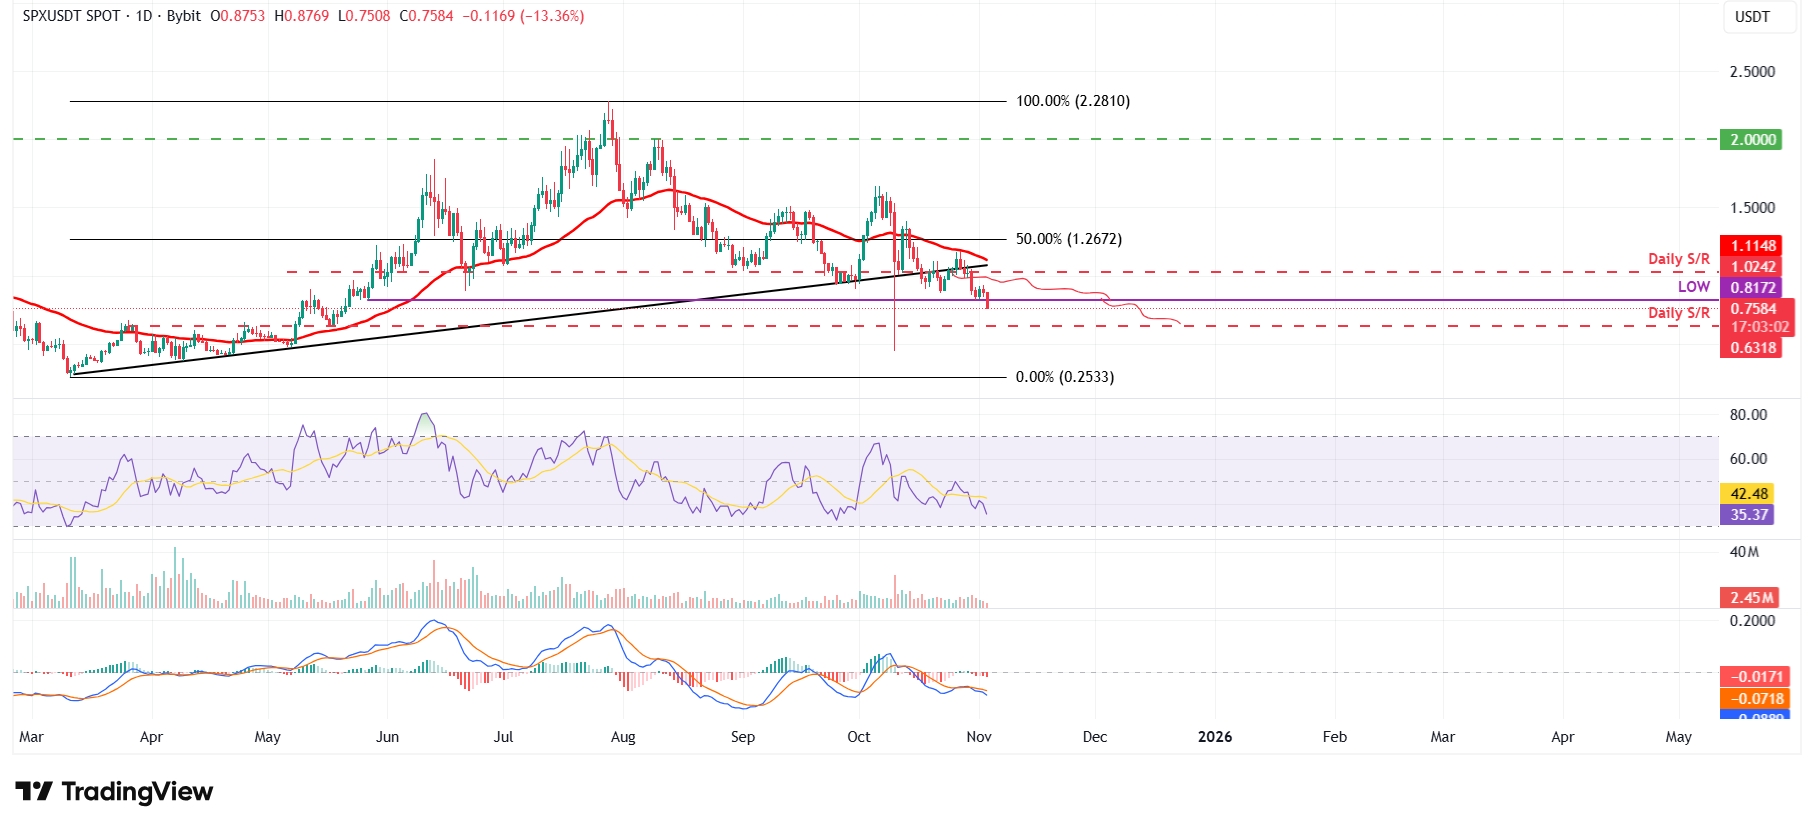
SPX/USDT daily chart
On the other hand, if SPX recovers, it could extend the recovery toward the daily resistance at $1.02.

Acuity Trading
Acuity Trading è una fintech con sede a Londra, fondata nel 2013, specializzata in dati alternativi basati su AI e analisi del sentiment per il trading e gli investimenti. Ha rivoluzionato l’esperienza di trading online con strumenti visivi di notizie e sentiment e continua a guidare il mercato con dati alternativi che generano alfa e strumenti di trading altamente coinvolgenti sfruttando le più recenti ricerche e tecnologie AI.
Read More


