
Cardano Price Forecast: ADA extends rally as whale accumulation, derivatives data, back bullish sentiment
Di Manish Chhetri
Data di Pubblicazione: 16 Mar 2026 | Data di Modifica: 16 Mar 2026


ARTICOLI POPOLARI

Cardano (ADA) price extends gains, trading above $0.27 on Monday, after surging over 8% and closing above the descending trendline last week.
- Cardano price extends gains on Monday after breaking above the descending trendline last week.
- Santiment data shows that certain whale wallets are accumulating ADA, signaling growing investor confidence.
- Derivatives data back a bullish sentiment, with rising open interest and positive funding rates supporting further upside.
Cardano (ADA) price extends gains, trading above $0.27 on Monday, after surging over 8% and closing above the descending trendline last week. On-chain and derivatives data paint a bullish picture, with large wallets increasing their ADA exposure alongside rising Open Interest (OI) and positive funding rates.
Holders’ increasing exposure boosts sentiment
Santiment’s Supply Distribution data supports a bullish outlook for Cardano, as certain whales are accumulating ADA tokens during recent dips.
The metric indicates that whales holding between 1 million and 10 million ADA tokens (yellow line) have accumulated a total of 60 million tokens from Friday to Monday. During the same period, wallets holding between 10 million and 100 million ADA tokens (blue line) have shed 50 million tokens.
This shows that the second cohort of whales could have fallen prey to the capitulation event. In contrast, the first set of wallets seized the opportunity and accumulated Cardano at a discount.
 [09-1773636072500-1773636072501.18.25, 16 Mar, 2026].png)
Derivatives data lean bullish
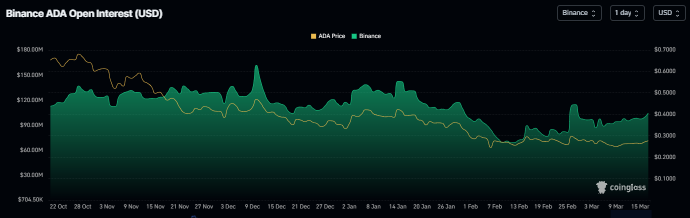
Apart from the holders accumulating, the derivative data also supports a positive bias. CoinGlass’ data show that the futures’ OI in Cardano on the Binance exchange has reached $104.63 million on Monday, steadily rising since early March. An increasing OI represents new or additional money entering the market and new buying, which could fuel the current ADA price rally.
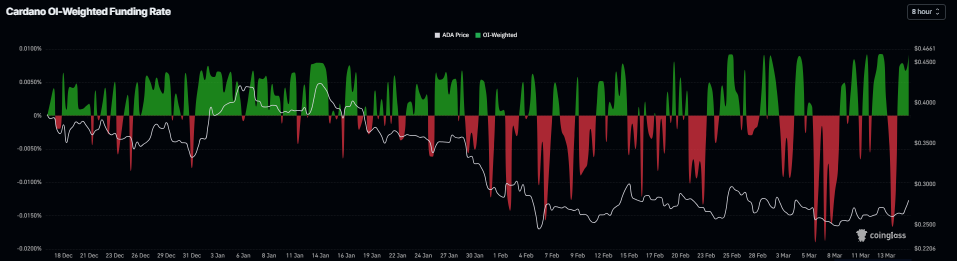
In addition, Cardano’s funding rates flipped positive on Sunday and surged to 0.009% on Monday, indicating that longs are paying shorts. Historically, as shown in the chart below, when funding rates have flipped from negative to positive and risen, the Cardano price has surged.
Cardano Price Forecast: ADA extends gains after breaking above the descending trendline
Cardano price is trading above $0.27 on Monday after ADA broke above the long-standing descending resistance trendline near $0.25, turning that breakout zone into a medium-term base.
Price remains below the 50-day and 100-day Exponential Moving Averages (EMAs) clustered around $0.29–$0.35, yet the Relative Strength Index (RSI) on the daily chart at 53 shows improving momentum above the midline. The Moving Average Convergence Divergence (MACD) line holds above its signal and above the zero line, with a modestly expanding positive histogram, suggesting buyers retain the initiative despite overhead moving-average pressure.
Immediate resistance stands at the recent swing high and horizontal barrier at $0.29, followed by the descending 100-day EMA band near $0.34. A daily close above $0.34 would open the way toward the $0.40 area.
On the downside, initial support is seen around $0.27, ahead of the former breakout region at $0.25 that aligns with the broken trend line. A loss of $0.25 would weaken the nascent bullish tone and expose the more distant horizontal support at $0.24.
-1773636150711-1773636150712.png)
(The technical analysis of this story was written with the help of an AI tool.)

Oltre un milione di utenti si affida a FXStreet per dati di mercato in tempo reale, strumenti di charting, approfondimenti di esperti e notizie Forex. Il loro calendario economico completo e i webinar formativi aiutano i trader a rimanere informati e a prendere decisioni ponderate. FXStreet conta circa 60 professionisti tra la sede di Barcellona e diverse regioni globali.
Leggi di più


