
Cardano Price Forecast: ADA flips bearish as derivatives markets flout network growth
Di Vishal Dixit
Data di Pubblicazione: 11 Dec 2025 | Data di Modifica: 11 Dec 2025


ARTICOLI POPOLARI

Cardano (ADA) extends losses by 5% at press time on Thursday, following the 3% decline on the previous day and breaking the local resistance trendline. Derivatives data indicate a bearish shift in the narrative, as Open Interest and the number of active long positions decline.
- Cardano is down 5%, extending the 3% reversal from a local resistance trendline.
- Derivatives data indicate a bearish bias as Open Interest falls, likely linked to the US Fed’s hawkish rate cut.
- On-chain data signals network growth, with transaction volume hitting a nine-month high.
Cardano (ADA) extends losses by 5% at press time on Thursday, following the 3% decline on the previous day and breaking the local resistance trendline. Derivatives data indicate a bearish shift in the narrative, as Open Interest and the number of active long positions decline. Still, on-chain data indicates a recent surge in network activity that could bolster long-term demand.
Technically. Cardano is at risk of further losses as the broader market reacts to the US Federal Reserve’s (Fed) hawkish quarter-point rate cut.
Bearish bias in derivatives overlooks Cardano’s network growth
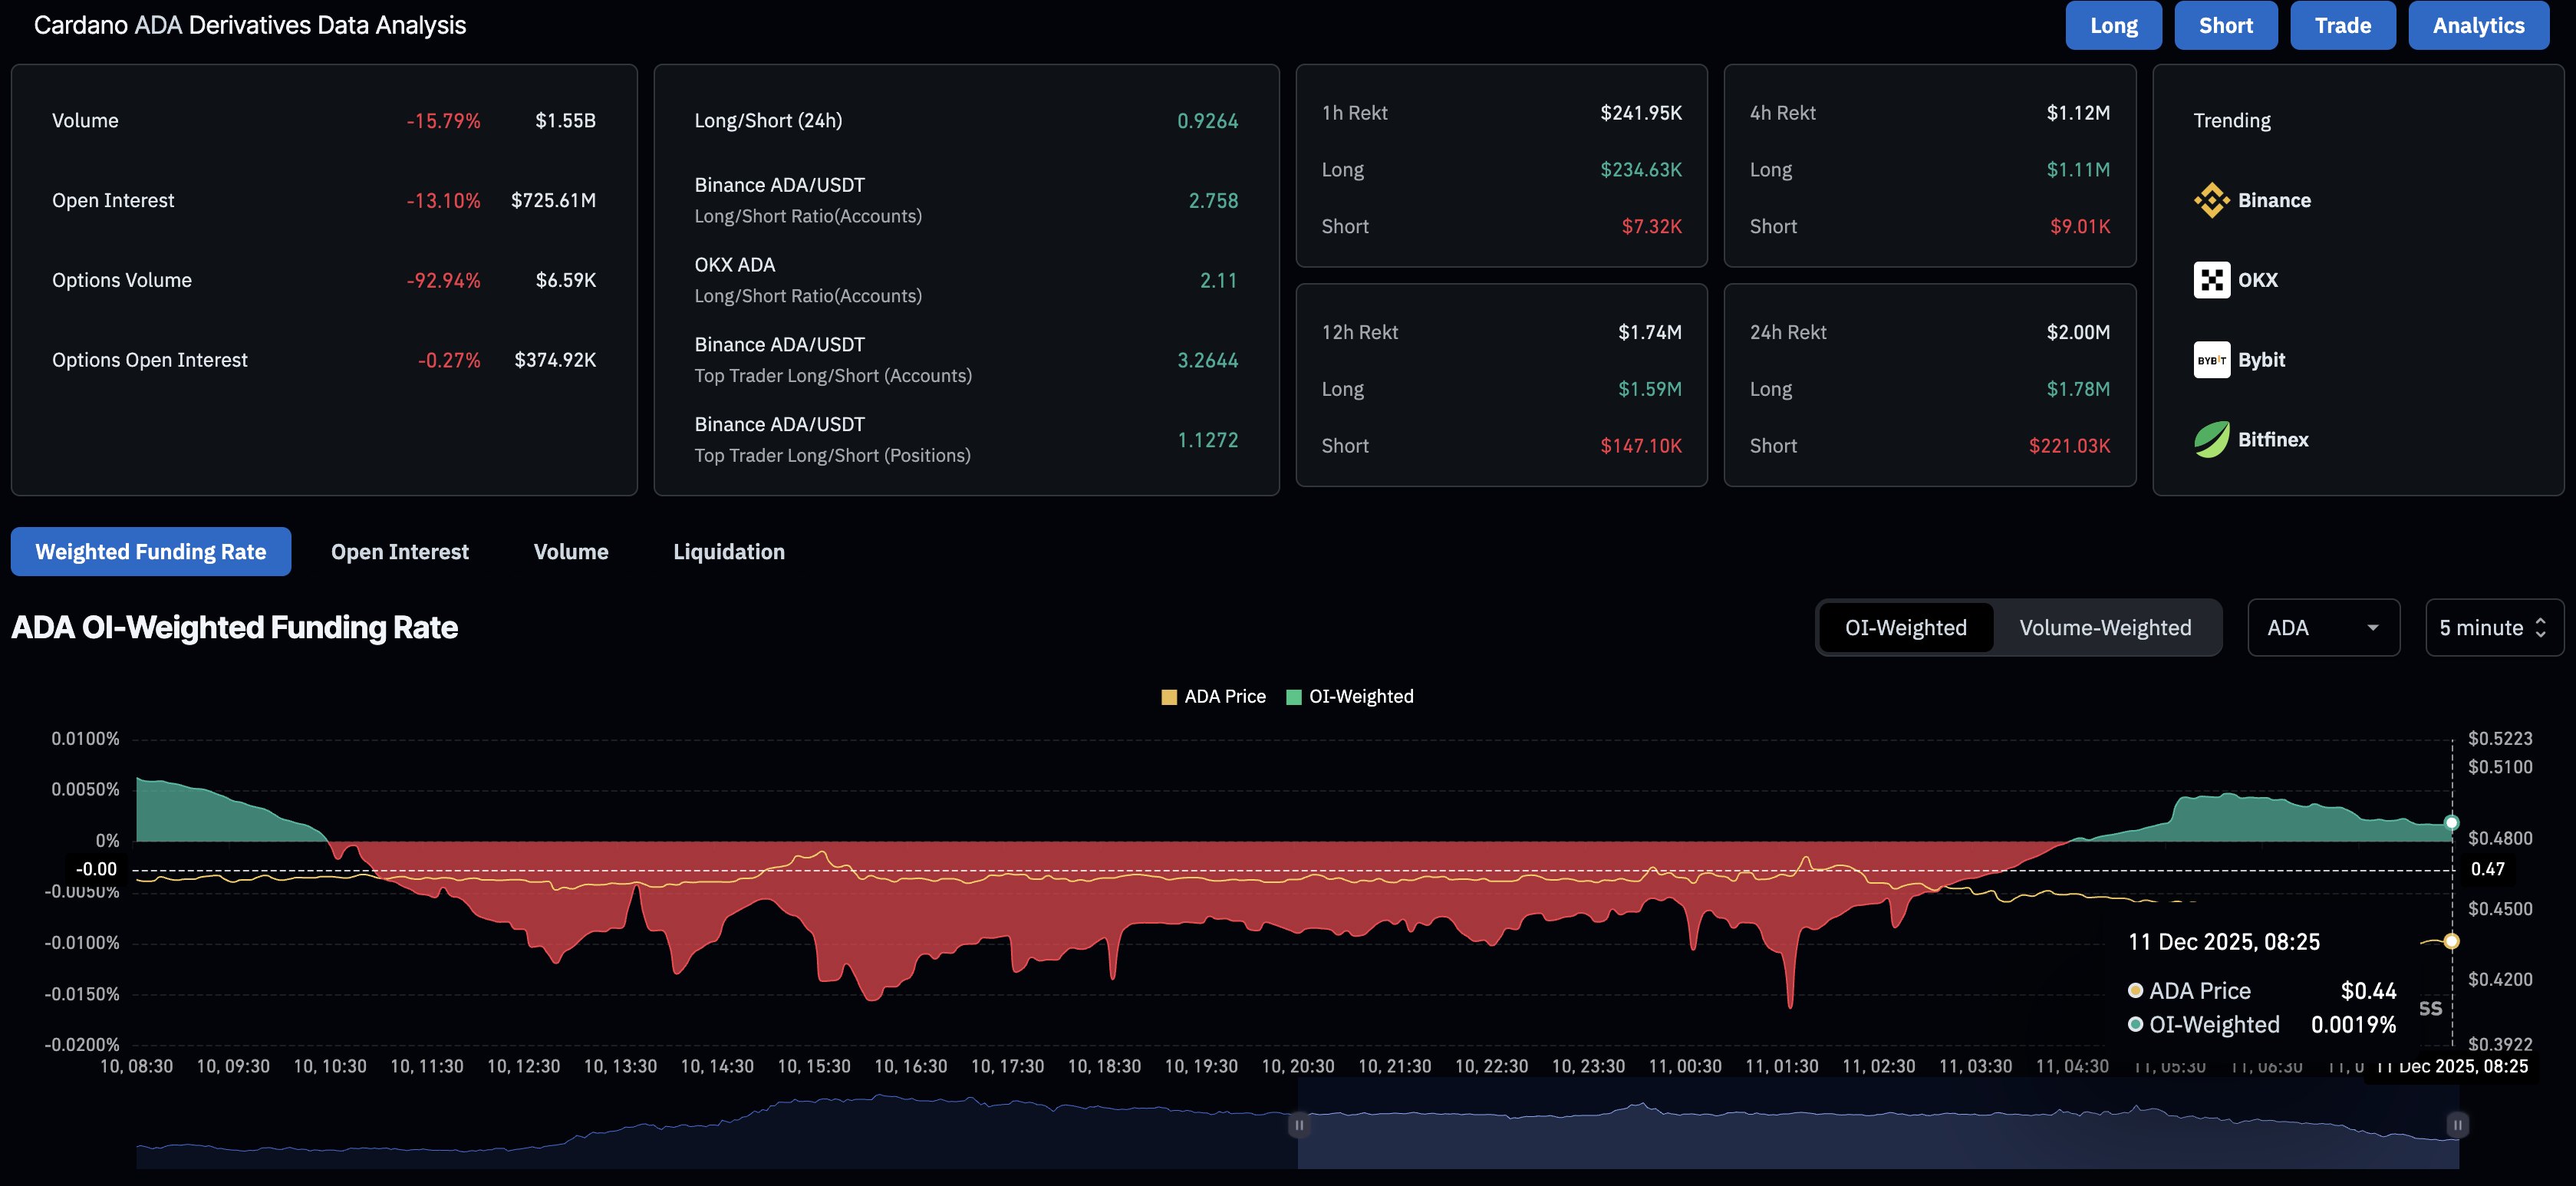
CoinGlass data shows a 13% drop in Cardano futures Open Interest (OI) over the last 24 hours to $725.61 million. This indicates a massive drop in active positions, including both longs and shorts, suggesting a decline in traders' risk appetite.
Amid the risk-off sentiment, the funding rate has dropped to 0.0019% from 0.0047% earlier in the day, suggesting a decline in bullish sentiment.
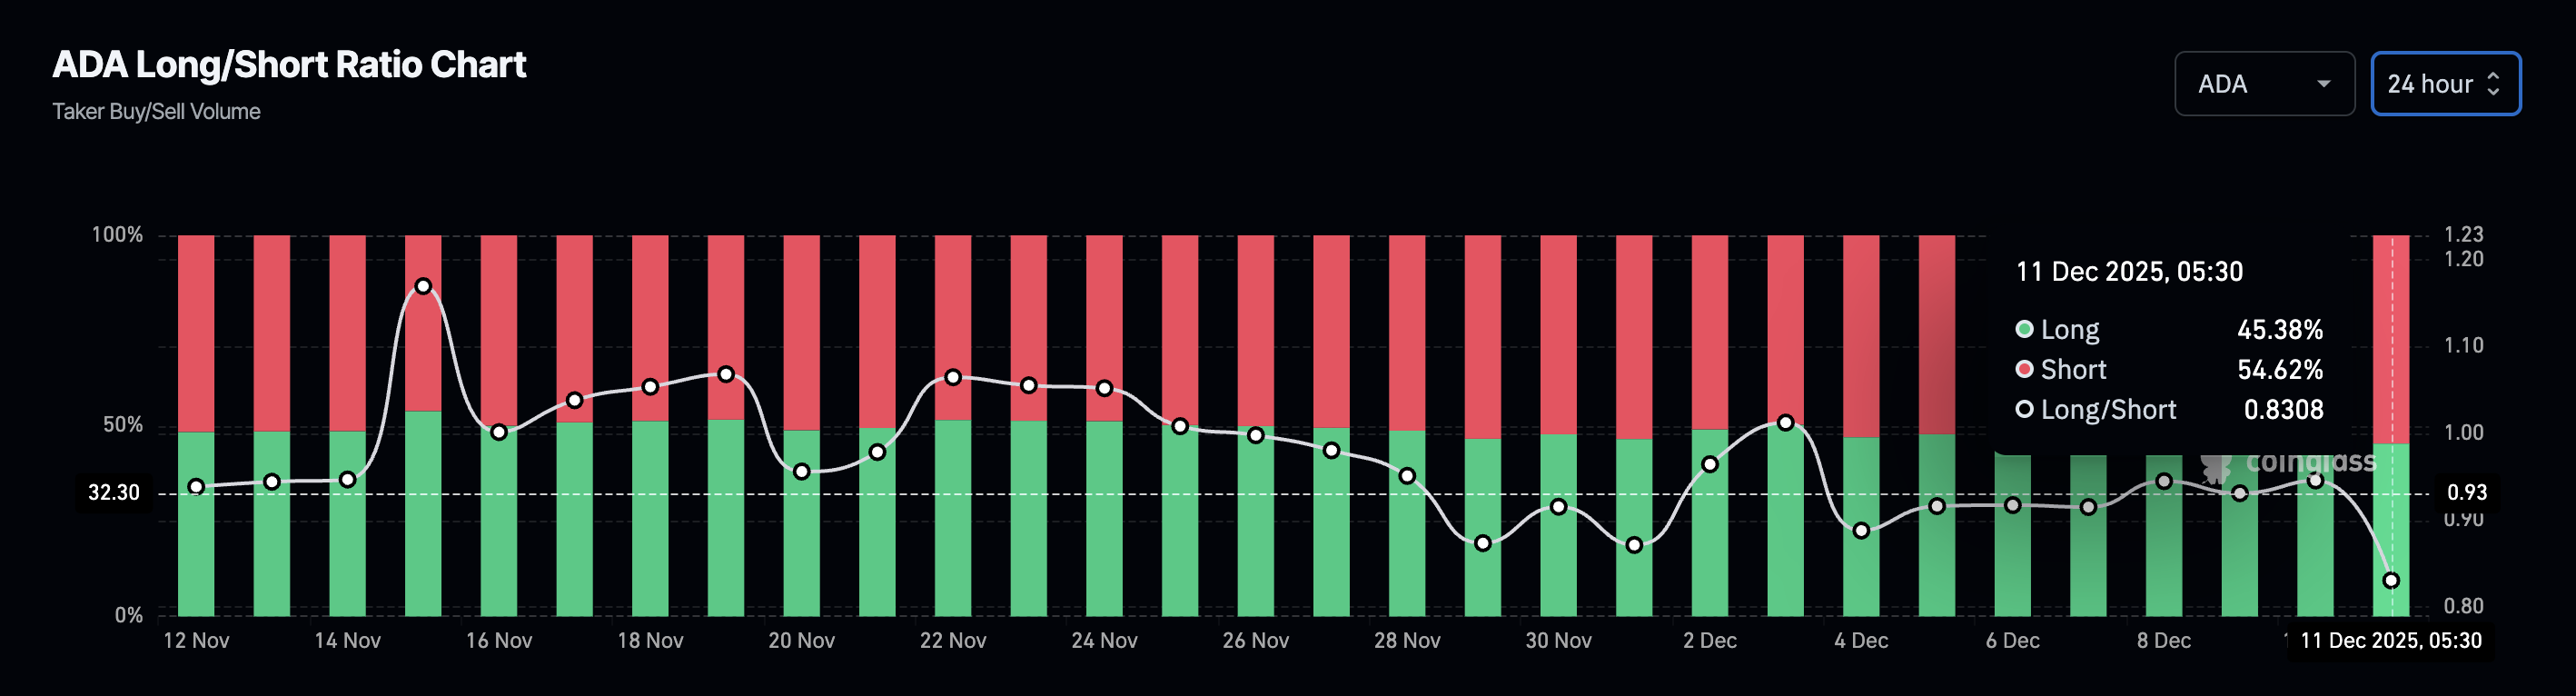
Along the same lines, the long-to-short ratio chart indicates a surge in bearish bets, reflecting traders' bearish anticipation. Short positions account for 54.62% of all active positions in the last 24 hours by press time.
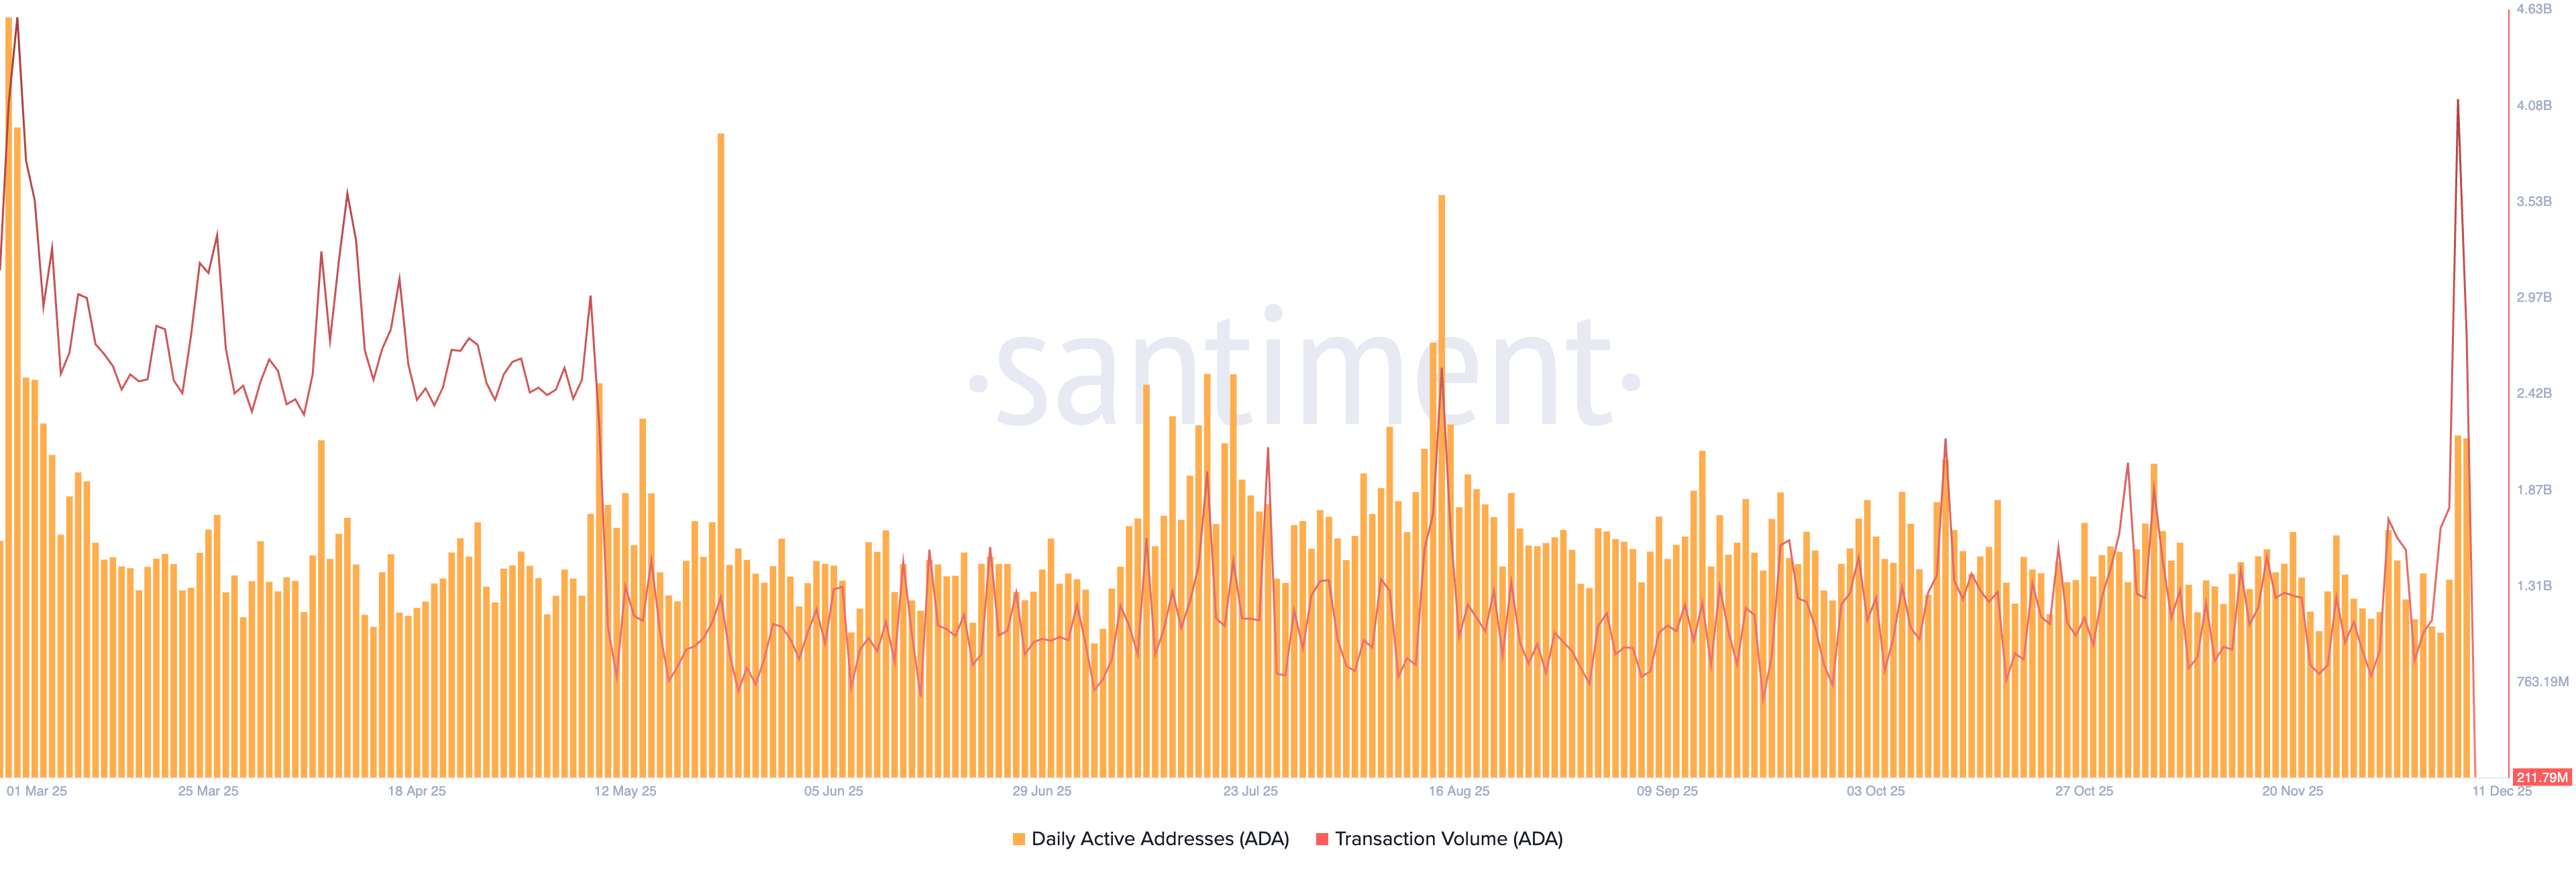
On the network side, Santiment data shows that transaction volume reached a nine-month high of 4.11 billion ADA on Tuesday. This indicates a surge in network activity that could bolster the demand for ADA if it sustains.
Additionally, the daily active addresses hit a near-four-month high of 34,229 on Tuesday, indicating renewed interest among network users.
Cardano’s pullback risks an over 10% drop
Cardano’s 3% pullback from the resistance trendline formed by connecting the October 27 and November 11 highs, aligning with the Supertrend indicator line at $0.48, extends the prevailing downward trend.
The reversal aims for the December 1 low at $0.3707, indicating a bearish potential of nearly 14% from the current market price.
The Relative Strength Index (RSI) on the daily chart is at 44, crossing below its midline, signaling that selling pressure is rising. With more room to the downside before reaching the oversold zone, the indicator warns of a steady correction in Cardano.
Still, the positive trend in the Moving Average Convergence Divergence (MACD) and its signal line remains intact, indicating residual bullish momentum. If the MACD crosses below the red line, it would confirm a renewal in bearish pressure.
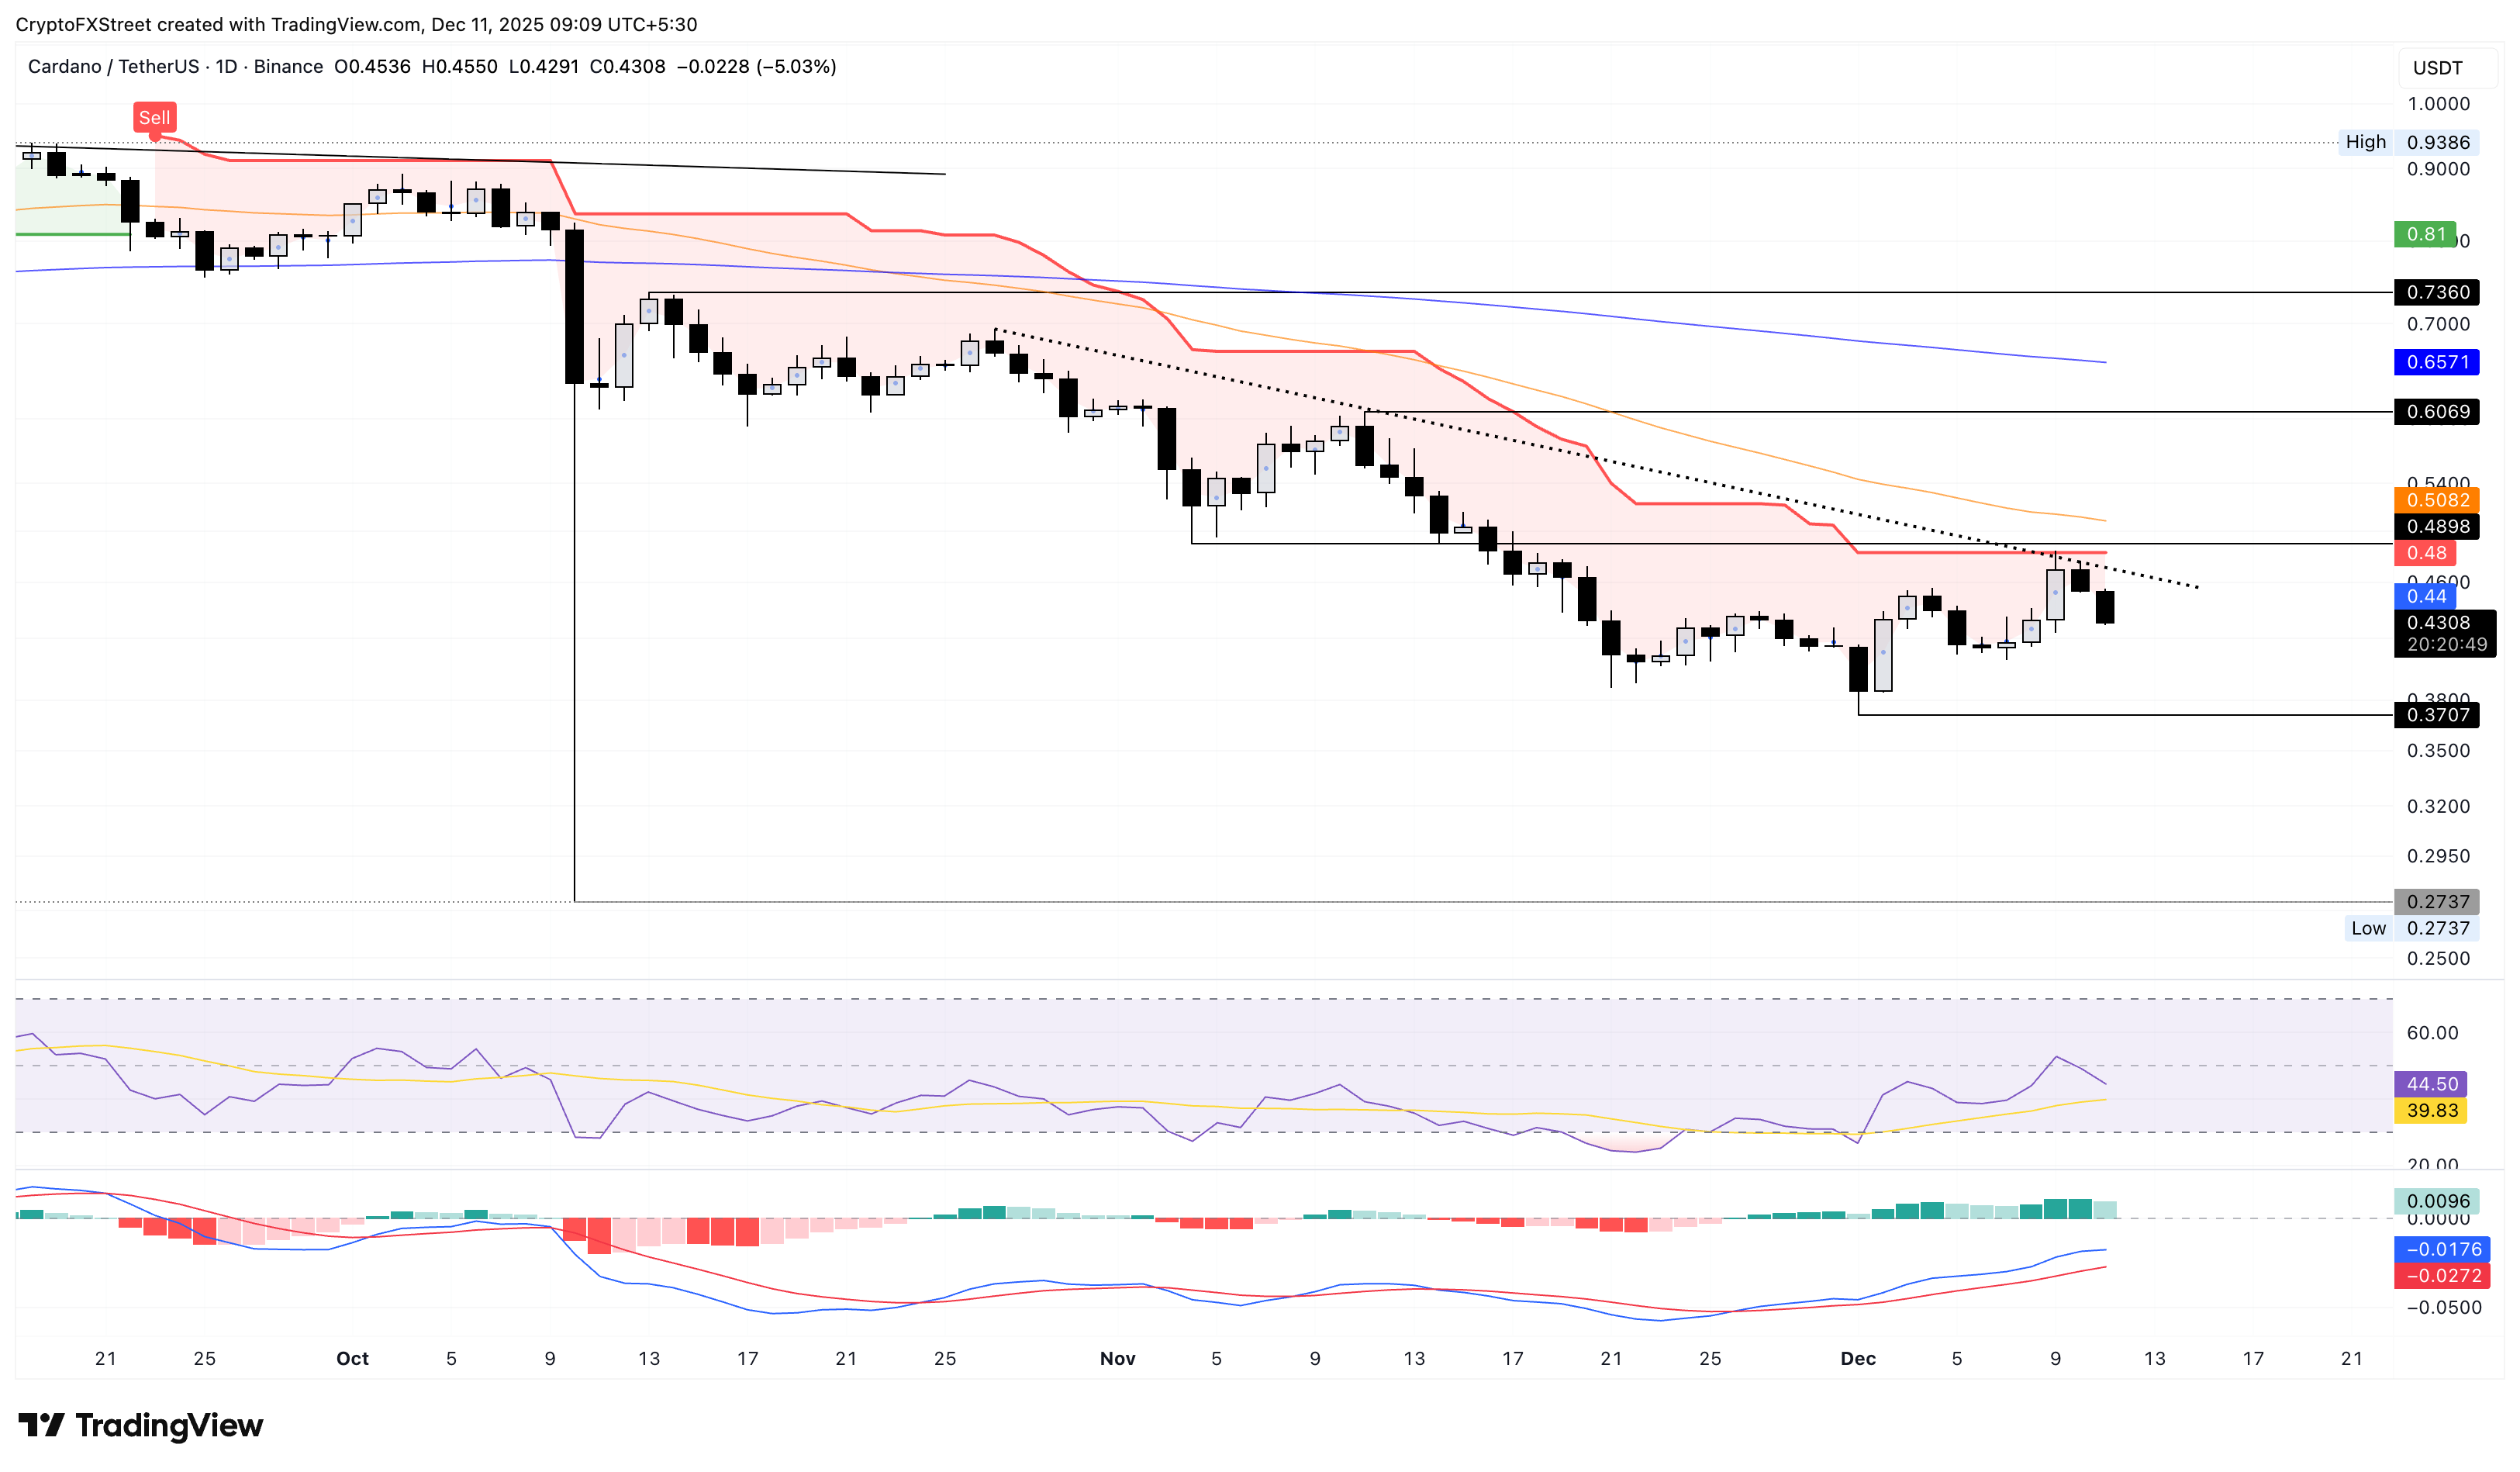
To reinstate an upward trend, Cardano should cross above $0.48, which would confirm the trendline breakout and flash a buy signal from the Supertrend Indicator. The breakout rally could push Cardano prices to $0.6069, a level marked by the November 11 high.

Oltre un milione di utenti si affida a FXStreet per dati di mercato in tempo reale, strumenti di charting, approfondimenti di esperti e notizie Forex. Il loro calendario economico completo e i webinar formativi aiutano i trader a rimanere informati e a prendere decisioni ponderate. FXStreet conta circa 60 professionisti tra la sede di Barcellona e diverse regioni globali.
Leggi di più


