
Cardano Price Forecast: ADA stalls as mixed signals limit recovery
Di Manish Chhetri
Data di Pubblicazione: 18 Feb 2026 | Data di Modifica: 18 Feb 2026


ARTICOLI POPOLARI

Cardano (ADA) steadies at $0.28 on Wednesday after failing to break through a key resistance zone over the weekend. Mixed signals from the derivatives and on-chain metrics suggest that ADA’s short-term outlook remains uncertain, limiting the scope for a recovery.
- Cardano price steadies at $0.28 after failing to break through the key resistance level.
- Derivatives data suggest limited recovery, with ADA’s open interest at very low levels alongside negative funding rates.
- Santiment data indicate mixed sentiment, with some holders accumulating, while social dominance continues to decline.
Cardano (ADA) steadies at $0.28 on Wednesday after failing to break through a key resistance zone over the weekend. Mixed signals from the derivatives and on-chain metrics suggest that ADA’s short-term outlook remains uncertain, limiting the scope for a recovery.
Cardano’s derivatives data show bearish bias
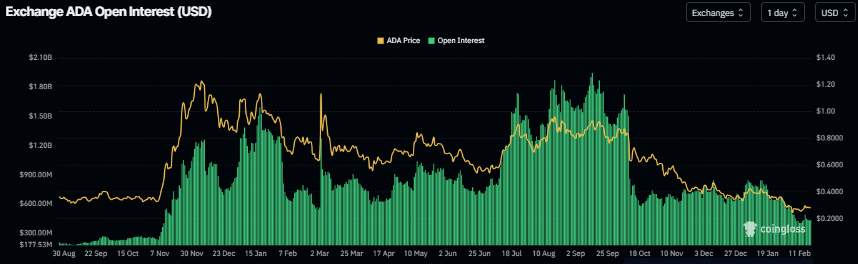
Cardano futures Open Interest (OI) falls to $436 million on Wednesday, having been steadily declining since mid-January and nearing the February 12 level of $407 million. This drop in OI reflects waning investor participation and projects a bearish outlook.
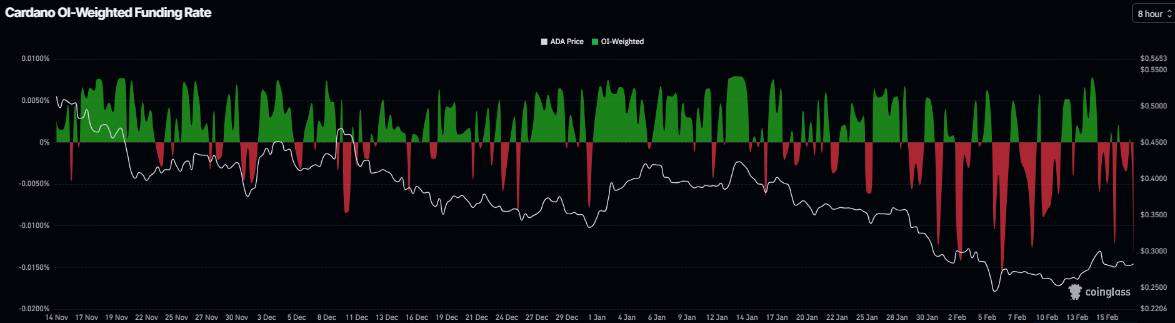
In addition, Coinglass’s OI-Weighted Funding Rate data shows that the number of traders betting that the price of Cardano will slide further is higher than those anticipating a price increase. The metric turned negative on Wednesday and stands at -0.0130%, nearing the February 6 levels, when ADA dropped sharply. The negative ratio suggests that shorts are paying longs, suggesting bearish sentiment toward ADA.
Mixed on-chain data signals indecision
Santiment’s Supply Distribution data supports a positive outlook for Cardano, as certain whales are buying ADA at recent price dips.
The metric indicates that whales holding between 1 million and 10 million ADA tokens (yellow line) and 10 million and 100 million tokens (blue line) have accumulated a total of 240 million ADA tokens since February 11.
 [09-1771393018898-1771393018900.26.58, 18 Feb, 2026].png)
Santiment’s Social Dominance metric for Cardano supports a bearish outlook. The index measures the share of ADA-related discussions across the cryptocurrency media. It has been in a downward trend since the end of December, falling again in early February to 0.038% on Wednesday. This fall indicates fading market interest and weakening sentiment among ADA investors. This combination of accumulation alongside weakening sentiment suggests indecision among investors and limits the chances of a sustained recovery.
 [09-1771393088046-1771393088046.28.23, 18 Feb, 2026].png)
Cardano Price Forecast: ADA faces rejection around the key resistance level
Cardano price was rejected at the 38.2% Fibonacci retracement level at $0.29 (drawn from the January 14 high of $0.42 to the February 6 low at $0.22) on Sunday, and it declined 4.47% that day. ADA has been hovering around the $0.28 level for the past two days and, as of Wednesday, remains there.
If ADA faces a correction, it could extend the losses to retest its weekly resistance at $0.24.
The Relative Strength Index (RSI) reads 44, below the neutral level of 50, indicating bearish momentum gaining traction. However, the Moving Average Convergence Divergence (MACD) showed a bullish crossover on February 13, which remains in place, suggesting that upside bias has not been invalidated yet.
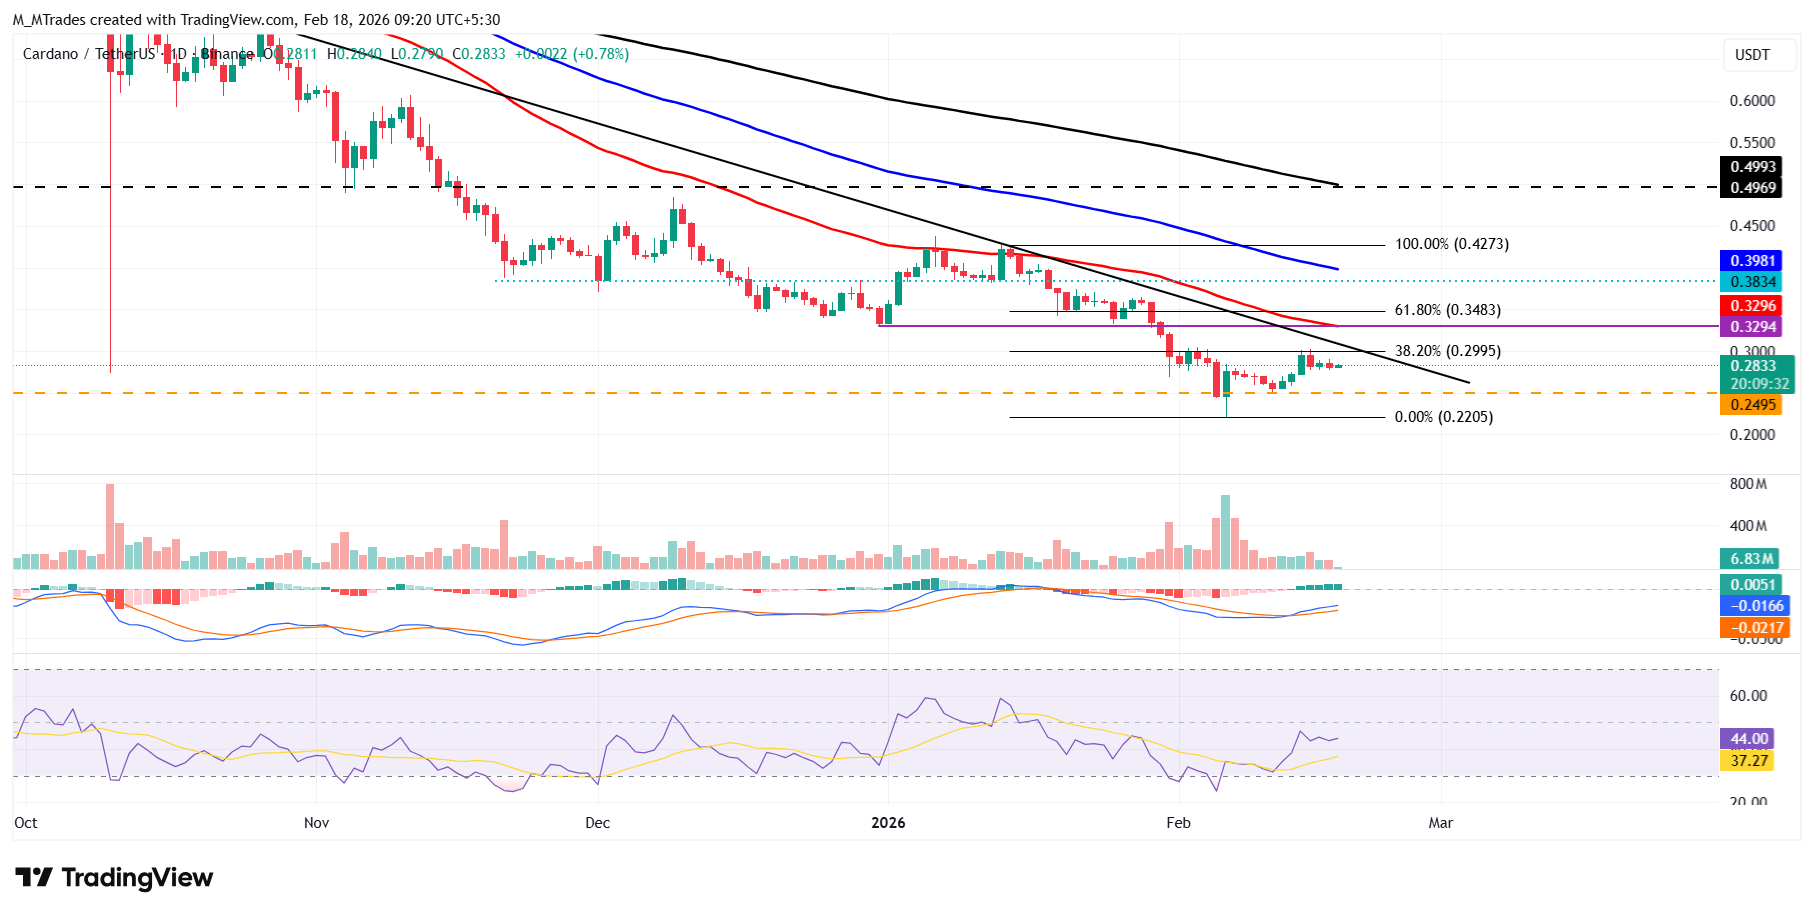
However, if ADA closes above the 38.2% Fibonacci retracement level at $0.29 on a daily basis, it could extend the recovery toward the 50-day Exponential Moving Average (EMA) at $0.32.

Oltre un milione di utenti si affida a FXStreet per dati di mercato in tempo reale, strumenti di charting, approfondimenti di esperti e notizie Forex. Il loro calendario economico completo e i webinar formativi aiutano i trader a rimanere informati e a prendere decisioni ponderate. FXStreet conta circa 60 professionisti tra la sede di Barcellona e diverse regioni globali.
Leggi di più


