
Cardano Price Forecast: ADA suffers from $900 million loss realization as prices bounce near $0.34
Di Michael Ebiekutan
Data di Pubblicazione: 20 Dec 2025 | Data di Modifica: 20 Dec 2025


ARTICOLI POPOLARI

Loss realization among Cardano (ADA) holders increased sharply in December, marking one of its heaviest capitulation months since 2023. Since the beginning of the month, investors have realized over $900 million in losses as of Friday.
ADA price today: $0.37
- ADA investors have booked over $900 million in losses in December.
- Investors who bought ADA in the past 365 days are holding average losses of nearly 40%.
- ADA is testing the resistance near $0.37 after bouncing off $0.34.
Loss realization among Cardano (ADA) holders increased sharply in December, marking one of its heaviest capitulation months since 2023. Since the beginning of the month, investors have realized over $900 million in losses as of Friday.
 [04-1766200998267-1766200998268.21.38, 20 Dec, 2025].png)
The move comes as bearish sentiment following the October 10 crash saw ADA erase all its gains from over the past 14 months.
With prices plunging toward $0.35, all ADA investors are holding an average loss of 40%. Notably, investors who bought the token in the past 365 days are also experiencing losses of a similar size.
As a result, most investors began cutting losses in December.
 [04-1766201047603-1766201047604.22.03, 20 Dec, 2025].png)
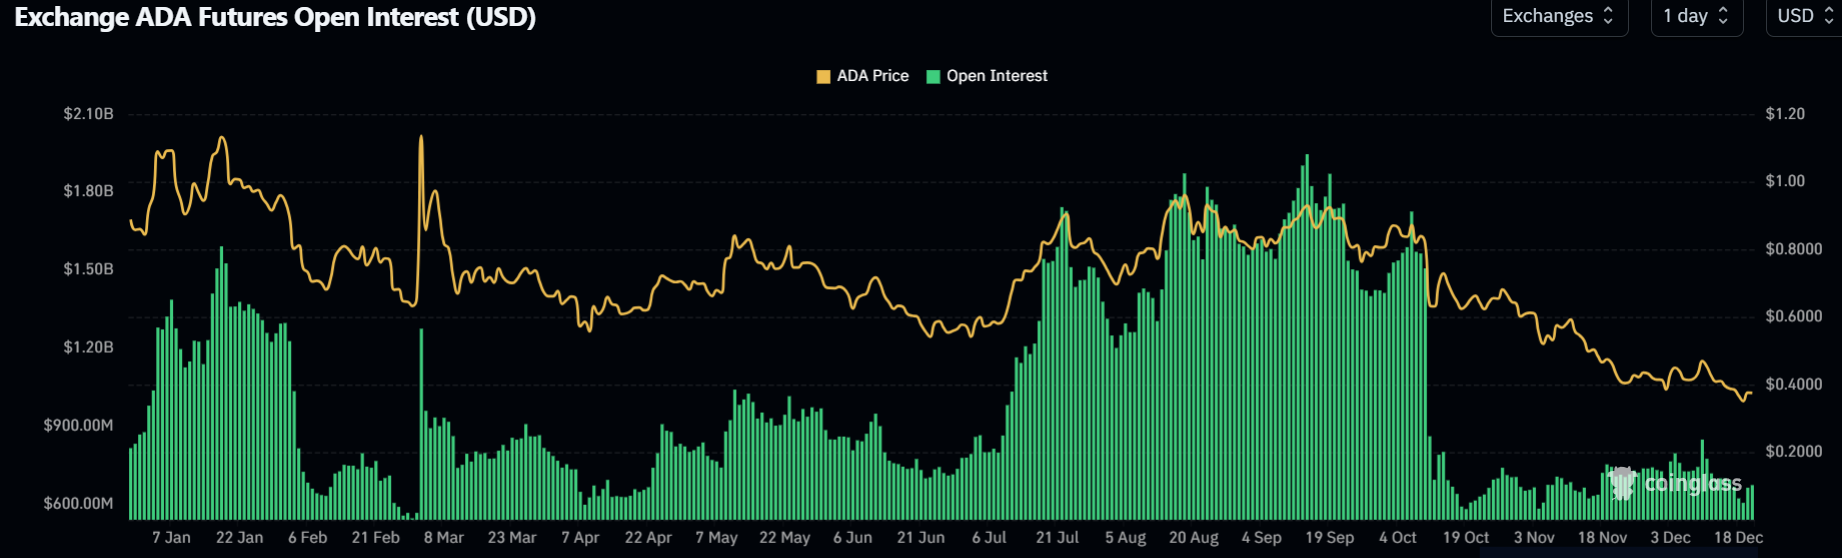
Large holders fueled selling activity amid open interest contraction
On the spot market, the intense selling pressure majorly flowed from wallets holding 1M-10M ADA, as their collective holdings dropped by 130M ADA since the beginning of the month.
On the derivatives side, ADA's futures open interest remains subdued at around $657 million as of Friday, with market participants staying on the sidelines since the October 10 crash.
ADA is trading at $0.37, up 4% at publication time on Saturday.
Cardano Price Forecast: ADA faces resistance at $0.37
ADA bounced off $0.34 and is testing the $0.37 resistance, near the upper boundary of the descending channel. The channel's resistance is strengthened by the 20-day Exponential Moving Average (EMA), which has proven a key hurdle since October 10.
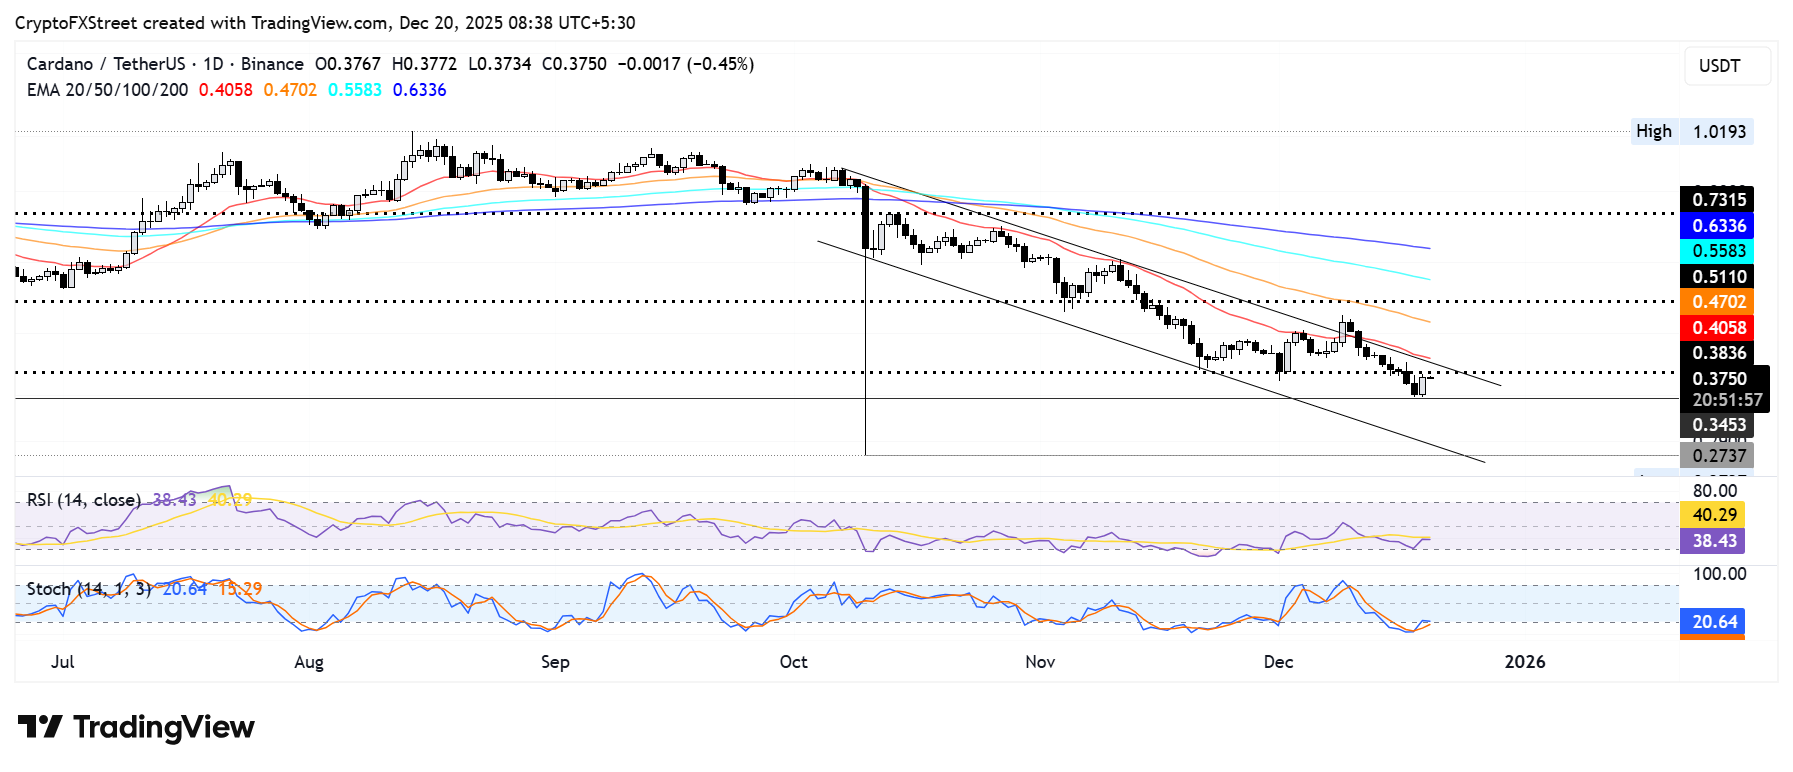
A rise above the descending channel could see ADA test the $0.51 level, but it has to clear the 50-day EMA on the way up. On the downside, ADA could find support at $0.34.
The Relative Strength Index (RSI) is below its neutral level and testing its moving average line. Meanwhile, the Stochastic Oscillator (Stoch) is attempting to recover from oversold conditions.

Oltre un milione di utenti si affida a FXStreet per dati di mercato in tempo reale, strumenti di charting, approfondimenti di esperti e notizie Forex. Il loro calendario economico completo e i webinar formativi aiutano i trader a rimanere informati e a prendere decisioni ponderate. FXStreet conta circa 60 professionisti tra la sede di Barcellona e diverse regioni globali.
Leggi di più


