
Dow Jones Industrial Average drops as hot PPI data fuels stagflation fears
Di Joshua Gibson
Data di Pubblicazione: 18 Mar 2026 | Data di Modifica: 18 Mar 2026


ARTICOLI POPOLARI

The Dow Jones Industrial Average fell nearly 1% on Wednesday, shedding over 450 points as a hotter-than-expected Producer Price Index (PPI) print landed on the same day as the Federal Open Market Committee (FOMC) rate decision.
- US wholesale inflation came in well above expectations, with producer prices rising 0.7% in February against a 0.3% forecast.
- The Federal Reserve (Fed) is set to hold interest rates steady as markets brace for updated economic projections.
- Oil prices climbed above $95 per barrel after Iran threatened to strike energy infrastructure in Saudi Arabia, Qatar and the UAE.
- Consumer staples and healthcare names led losses on the Dow, while energy and industrial stocks bucked the trend.
The Dow Jones Industrial Average fell nearly 1% on Wednesday, shedding over 450 points as a hotter-than-expected Producer Price Index (PPI) print landed on the same day as the Federal Open Market Committee (FOMC) rate decision. The S&P 500 dropped around 0.7% and the Nasdaq Composite lost roughly 0.5%, with risk appetite squeezed by accelerating inflation data and elevated Crude Oil prices. The session reflected growing unease about the Fed's ability to cut rates this year, with price pressures still building.
Wholesale inflation accelerates across the board
The Bureau of Labor Statistics (BLS) reported that the PPI for final demand rose 0.7% month-over-month in February, more than double the 0.3% consensus estimate and up from a 0.5% increase in January. On a year-over-year basis, headline PPI accelerated to 3.4%, its highest reading in a year and well above the 2.9% forecast. Core PPI, stripping out food and energy, rose 0.5% on the month against expectations for 0.3%, while the annual core reading jumped to 3.9% from 3.5%. The data is particularly concerning because it captures price pressures before the full impact of surging energy costs from the Iran conflict showed up. Analysts noted that tariff-related input costs in metals and industrial materials were a key driver.
Fed holds rates as stagflation risk builds
The FOMC is broadly expected to hold the federal funds rate steady on Wednesday, however the accompanying Summary of Economic Projections (SEP) and updated dot plot will be the main event, with Wall Street watching for any shift in the committee's rate path. In December, the median dot had pointed to just one 25-basis-point cut in 2026, and most analysts expected little change given the conflicting signals from a softening labor market and sticky inflation. The CME FedWatch Tool showed futures pricing in only a single rate cut by year-end, most likely in December, with a near-zero probability of any easing before September. Chair Jerome Powell, in what will be one of his final press conferences before his term expires in May, is expected to emphasize the uncertainty created by the Middle East conflict while reinforcing a data-dependent stance.
Iran escalation keeps Oil bid and equities on edge
Oil prices surged roughly 3% on Wednesday after Iran threatened retaliatory strikes against energy infrastructure in Saudi Arabia, Qatar and the UAE. West Texas Intermediate (WTI) crude pushed above $95 per barrel, adding to a rally that has seen prices climb roughly 50% since the start of the year. Israel reportedly struck Iran's largest gas processing facility, further escalating the conflict and tightening the effective closure of the Strait of Hormuz. The Trump administration issued a 60-day Jones Act waiver to allow Oil, natural gas, fertilizer and coal to move freely between US ports in an attempt to ease domestic supply pressures. Gold, meanwhile, pulled back below $5,000 per ounce as rate uncertainty weighed on the metal ahead of the Fed decision.
Energy and industrials outperform while consumer names lag
On the Dow, Caterpillar (CAT) led gainers with a roughly 1% advance after KeyBanc upgraded Dow (DOW) to overweight, citing benefits to US ethylene producers from higher Oil prices and tight global capacity. Goldman Sachs (GS) also added about 1% as elevated volatility continued to support trading revenue expectations. On the downside, Amgen (AMGN), Sherwin-Williams (SHW) and Procter & Gamble (PG) each fell around 2%, with consumer staples under pressure from margin concerns tied to rising input costs. Elsewhere, Nvidia (NVDA) edged higher after Reuters reported that China approved the sale of its H200 chips, while the chipmaker's ongoing GTC conference continued to generate headlines around a $1 trillion revenue opportunity through 2027.
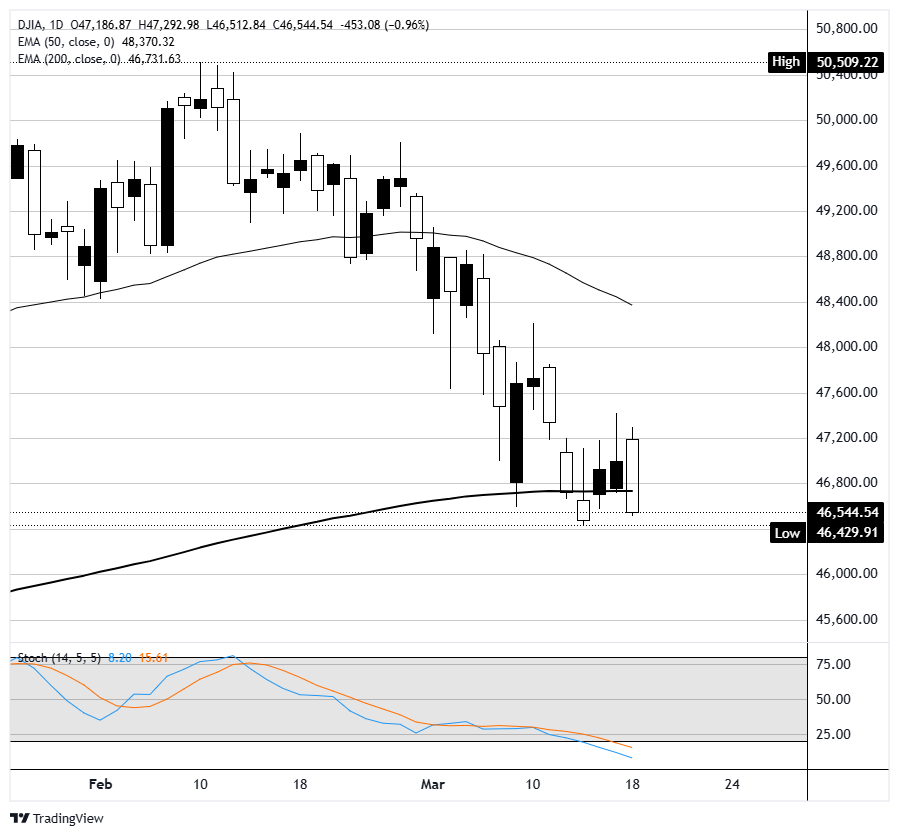
Dow Jones daily chart
Dow Jones FAQs
The Dow Jones Industrial Average, one of the oldest stock market indices in the world, is compiled of the 30 most traded stocks in the US. The index is price-weighted rather than weighted by capitalization. It is calculated by summing the prices of the constituent stocks and dividing them by a factor, currently 0.152. The index was founded by Charles Dow, who also founded the Wall Street Journal. In later years it has been criticized for not being broadly representative enough because it only tracks 30 conglomerates, unlike broader indices such as the S&P 500.
Many different factors drive the Dow Jones Industrial Average (DJIA). The aggregate performance of the component companies revealed in quarterly company earnings reports is the main one. US and global macroeconomic data also contributes as it impacts on investor sentiment. The level of interest rates, set by the Federal Reserve (Fed), also influences the DJIA as it affects the cost of credit, on which many corporations are heavily reliant. Therefore, inflation can be a major driver as well as other metrics which impact the Fed decisions.
Dow Theory is a method for identifying the primary trend of the stock market developed by Charles Dow. A key step is to compare the direction of the Dow Jones Industrial Average (DJIA) and the Dow Jones Transportation Average (DJTA) and only follow trends where both are moving in the same direction. Volume is a confirmatory criteria. The theory uses elements of peak and trough analysis. Dow’s theory posits three trend phases: accumulation, when smart money starts buying or selling; public participation, when the wider public joins in; and distribution, when the smart money exits.
There are a number of ways to trade the DJIA. One is to use ETFs which allow investors to trade the DJIA as a single security, rather than having to buy shares in all 30 constituent companies. A leading example is the SPDR Dow Jones Industrial Average ETF (DIA). DJIA futures contracts enable traders to speculate on the future value of the index and Options provide the right, but not the obligation, to buy or sell the index at a predetermined price in the future. Mutual funds enable investors to buy a share of a diversified portfolio of DJIA stocks thus providing exposure to the overall index.

Oltre un milione di utenti si affida a FXStreet per dati di mercato in tempo reale, strumenti di charting, approfondimenti di esperti e notizie Forex. Il loro calendario economico completo e i webinar formativi aiutano i trader a rimanere informati e a prendere decisioni ponderate. FXStreet conta circa 60 professionisti tra la sede di Barcellona e diverse regioni globali.
Leggi di più


