
EUR/JPY Price Forecast: Tests 187.00 resistance as bullish bias holds
Di Akhtar Faruqui
Aggiornato: 20 Apr 2026


ARTICOLI POPOLARI

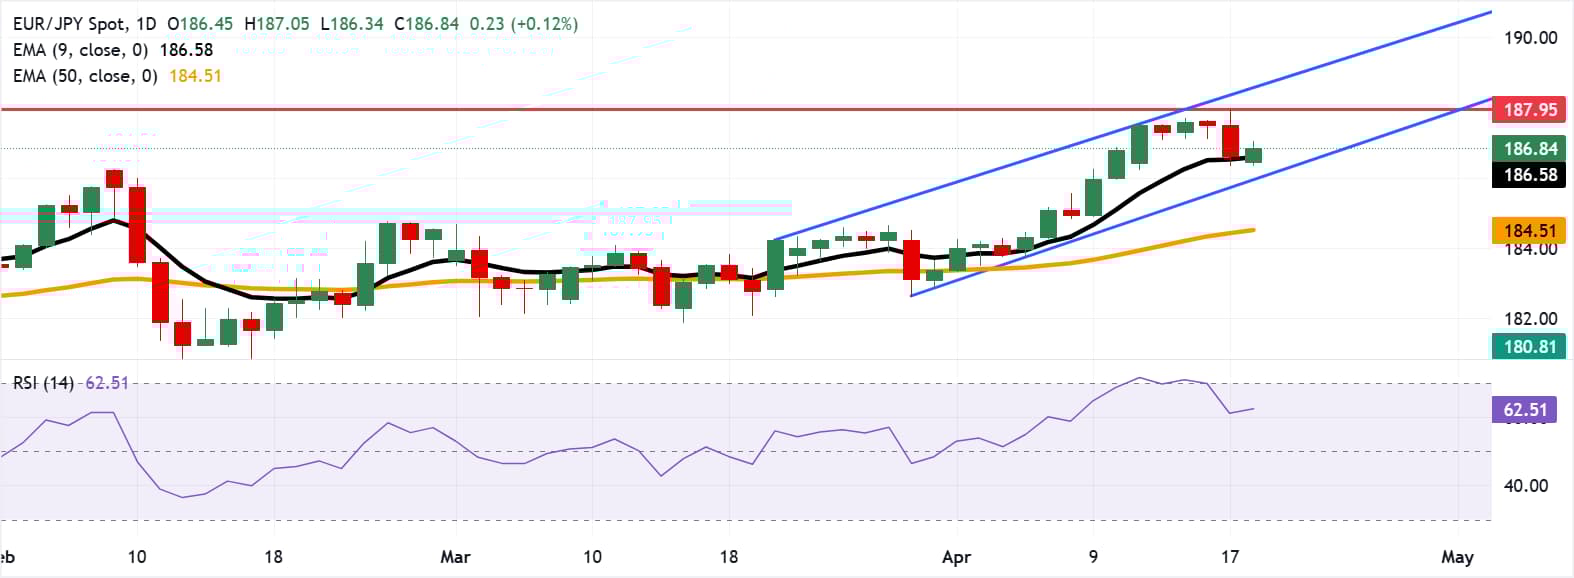
EUR/JPY gains ground after registering nearly 0.5% losses the previous trading day, hovering around 186.80 during Asian hours on Monday. The technical analysis of the daily chart indicates the currency cross is trending higher within an ascending channel, signaling a persistent bullish bias.
- EUR/JPY may test resistance at the psychological level of 187.00.
- The 14-day Relative Strength Index at 62.30 remains positive, not yet overbought.
- The primary support lies at the nine-day EMA of 186.58.
EUR/JPY gains ground after registering nearly 0.5% losses the previous trading day, hovering around 186.80 during Asian hours on Monday. The technical analysis of the daily chart indicates the currency cross is trending higher within an ascending channel, signaling a persistent bullish bias.
The EUR/JPY cross maintains a bullish near-term bias as it holds above both the nine- and the 50-period Exponential Moving Averages (EMAs), keeping the broader uptrend supported.
The 14-day Relative Strength Index at 62.30 sits in positive territory without being extreme, which suggests underlying buying pressure remains constructive while leaving room for further upside.
The EUR/JPY cross may find immediate resistance at the psychological level of 187.00, followed by the all-time high of 187.95, which was recorded on April 17. Further advances would support the currency cross to test the upper boundary of the ascending channel around 188.60.
On the downside, the EUR/JPY cross may find its primary support at the nine-day EMA of 186.58, followed by the lower ascending channel boundary around 186.00. A sustained break below the channel would expose the 50-day EMA at 184.51.
(The technical analysis of this story was written with the help of an AI tool.)
Euro Price Today
The table below shows the percentage change of Euro (EUR) against listed major currencies today. Euro was the strongest against the Australian Dollar.
| USD | EUR | GBP | JPY | CAD | AUD | NZD | CHF | |
|---|---|---|---|---|---|---|---|---|
| USD | 0.03% | 0.07% | 0.16% | 0.00% | 0.22% | 0.07% | 0.08% | |
| EUR | -0.03% | 0.04% | 0.09% | -0.05% | 0.17% | 0.02% | 0.03% | |
| GBP | -0.07% | -0.04% | 0.06% | -0.06% | 0.12% | -0.02% | -0.02% | |
| JPY | -0.16% | -0.09% | -0.06% | -0.13% | 0.08% | -0.10% | -0.07% | |
| CAD | 0.00% | 0.05% | 0.06% | 0.13% | 0.21% | 0.04% | 0.05% | |
| AUD | -0.22% | -0.17% | -0.12% | -0.08% | -0.21% | -0.15% | -0.17% | |
| NZD | -0.07% | -0.02% | 0.02% | 0.10% | -0.04% | 0.15% | -0.00% | |
| CHF | -0.08% | -0.03% | 0.02% | 0.07% | -0.05% | 0.17% | 0.00% |
The heat map shows percentage changes of major currencies against each other. The base currency is picked from the left column, while the quote currency is picked from the top row. For example, if you pick the Euro from the left column and move along the horizontal line to the US Dollar, the percentage change displayed in the box will represent EUR (base)/USD (quote).

Oltre un milione di utenti si affida a FXStreet per dati di mercato in tempo reale, strumenti di charting, approfondimenti di esperti e notizie Forex. Il loro calendario economico completo e i webinar formativi aiutano i trader a rimanere informati e a prendere decisioni ponderate. FXStreet conta circa 60 professionisti tra la sede di Barcellona e diverse regioni globali.
Leggi di più


